
In this article, I'm going to tell you about PVS-Studio, an analyzer for C and C++ code, and show you how to use it in the Visual C++ environment. This guide is specifically intended for beginner users.
Installing the analyzer
PVS-Studio supports Microsoft Visual Studio 2019, 2017, 2015, 2013, 2012, and 2010. See the documentation for the system requirements. Currently, PVS-Studio can analyze projects written in C, C++, C#, and Java. However, this article focuses on programmers who work in Visual C++ and are looking for help to get started with the analyzer.
The installation package can be downloaded here. After running it, you'll be offered a number of integration options (Figure 1) to choose from. Unavailable options are greyed out.
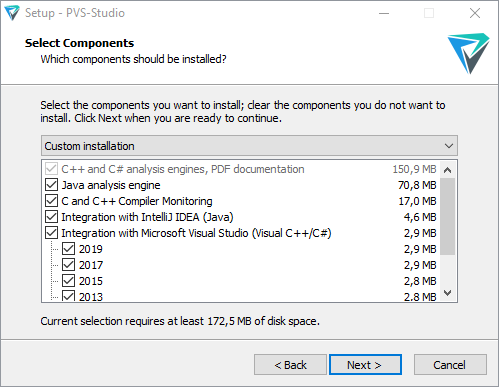
Figure 1. Integration components selection window.
After you have installed PVS-Studio, open the About window of Visual Studio and make sure the analyzer is present among installed products.
Checking a project
Once the installation is complete, you can go on to check your project. You can also try analyzing the entire solution. To do that, click Extensions → PVS-Studio → Check → Solution (Figure 2).
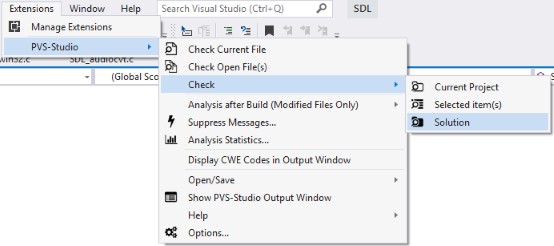
Figure 2. Checking a solution with PVS-Studio.
If you have any difficulties running the check, see the "PVS-Studio: Troubleshooting" section on our website. Those are not some dumb hints like «make sure the plug is plugged into the outlet». The section describes typical issues that our users have reported and ways to solve them.
Handling the warnings list
Once the check is complete, the diagnostic messages will appear in a special window. This window has a lot of elements, which all serve to manipulate the list so that you can view only the warnings of interest. At first, however, it might look somewhat complicated.
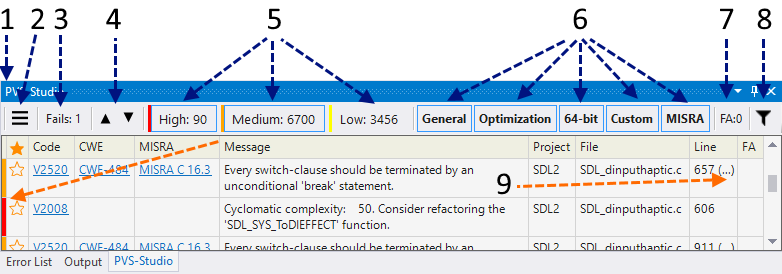
Figure 3. Warnings window. Click on the image to enlarge.
The complete overview of the window's elements can be found in the documentation, but now we'll focus only on the basic ones:
- Warnings' certainty levels. The screenshot above shows the medium and high levels enabled. The low level deals more with «Code Smells» and warnings that, unfortunately, tend to produce too many false positives. Why are there so many low- and medium-level warnings but so few high-level ones? The answer is that the MISRA diagnostics have been enabled, which contain rules such as «the function should have only a single exit point». Of course, you normally don't need these diagnostics, so they are disabled by default. Note: "How to quickly check out interesting warnings given by the PVS-Studio analyzer for C and C++ code?".
- The filter. You can filter the messages by code, CWE, text, project, or file.
- The number of the triggering line. Some diagnostics can refer to a number of lines: such warnings have an ellipsis next to the line number.
SAST
PVS-Studio is a tool for static application security testing (SAST), which means it can detect potential vulnerabilities in source code and show the corresponding weakness identifier according to a particular classification.
PVS-Studio supports the following weakness classifications:
- CWE
- SEI CERT
- MISRA
To enable CWE codes, open the analyzer window's drop-down menu and then tick Show Columns > CWE
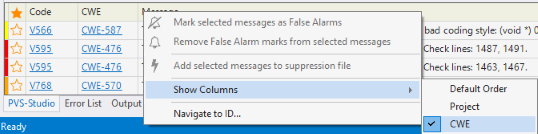
Figure 4. Enabling CWE codes from the drop-down menu.
Another way to do that is Extensions > PVS-Studio > Display CWE Codes in Output Window on Visual Studio's menu bar
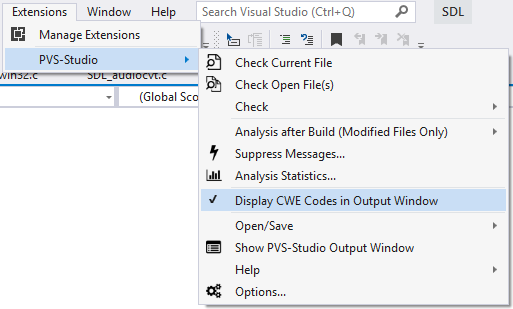
Figure 5. PVS-Studio submenu in the Extensions menu.
Unlike that, MISRA diagnostics are enabled in the options window:
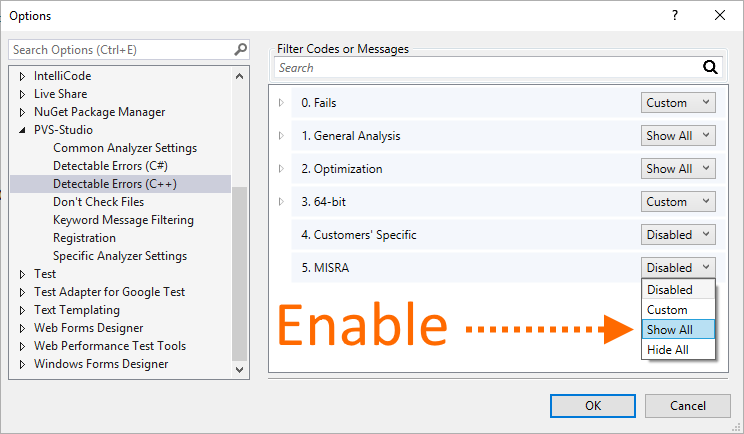
Figure 6. List of detectable weaknesses.
You can learn more about these classifications here.
Checking projects from the command line
PVS-Studio_Cmd.exe is a utility to check C++ .vcxproj projects and solutions from the command line. It can be useful if you want to automate the analysis process. The program can be found in the installation directory, which is 'C:\Program Files (x86)\PVS-Studio' by default.
The utility has multiple parameters, but you'll need only three to get started:
- --target: the file of the project or solution to be checked.
- --output: the plog file to store the analysis report to.
- --progress: track the analysis progress.
This is what you will see after starting the check:
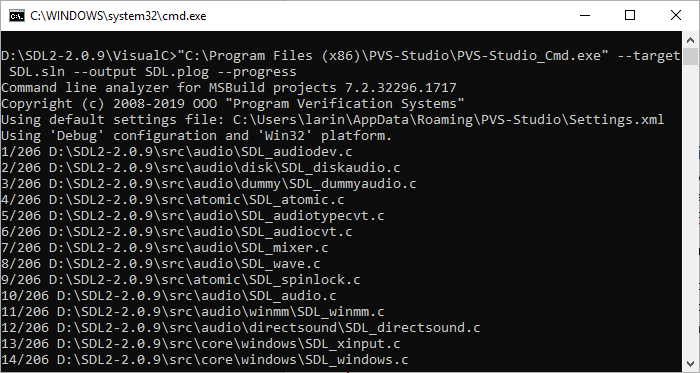
Figure 7. Output of the PVS-Studio_Cmd.exe utility
Once the check is finished, a plog file containing the analysis report will be created in the directory specified in the start parameters. This report can be converted into other formats using the PlogConverter.exe utility, and if you want to open the report in the IDE, simply double-click on the plog file in the Windows Explorer.
The report file can also be opened from the Extensions menu: Extensions > PVS-Studio > Open/Save > Open Analysis Report…
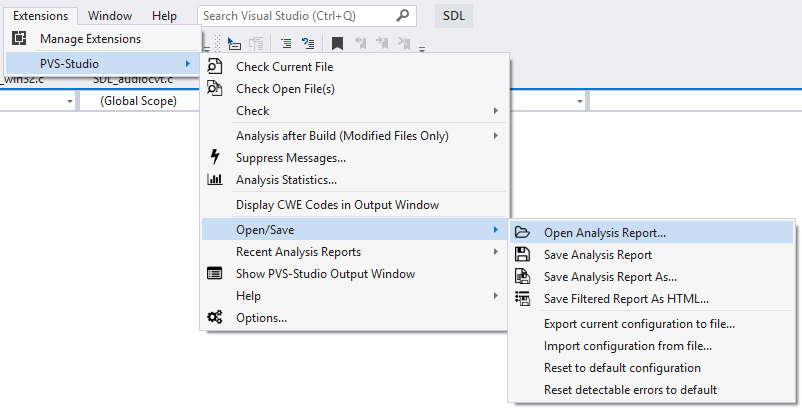
Figure 8. Opening an analysis report from the plugin's menu.
See the documentation for details on the utility and its parameters.
Suppressing false positives
The analyzer provides a variety of means to suppress false positives. They are described in detail in the following sections:
- Fine tuning.
- Mass suppression, which is especially useful when you want to suppress only those warnings that refer to new or modified code.
Sample warning
Let's take a look at an example of a warning issued by the analyzer. The following code snippet is taken from the ReactOS project:
VOID NTAPI
AtapiDmaInit(....)
{
  ....
  ULONG treg = 0x54 + (dev < 3) ? (dev << 1) : 7;
  ....
}
PVS-Studio's diagnostic message: V502 Perhaps the '?:' operator works in a different way than it was expected. The '?:' operator has a lower priority than the '+' operator. uniata id_dma.cpp 1610
The 0x54 + (dev < 3) expression will always evaluate to true: the non-null constant 0x54 is first added to the result of the (dev < 3) expression, which can evaluate either to 0 or 1, and only then is the resulting value compared with zero.
This is what the correct version looks like:
VOID NTAPI
AtapiDmaInit(....)
{
  ....
  ULONG treg = 0x54 + ((dev < 3) ? (dev << 1) : 7);
  ....
}
We have solved the issue by enclosing the '?:' operation in parentheses so that its result will now depend on the result of the (dev < 3) expression.
Conclusion
That was a brief introduction into getting started with PVS-Studio for Visual C++. It doesn't cover all of the aspects, of course, so welcome to our blog, where we explain in detail how to work with the analyzer, and see the documentation for complete descriptions of the diagnostic messages and tool's settings.
