 PVS-Studio supports analyzing projects developed in C, C++, C#, and Java. You can use the analyzer under Windows, Linux, and macOS. This small article will tell you the basics of analyzing C and C++ code in Linux environment.
Installation
There are different ways to install PVS-Studio under Linux, depending on your distro type. The most convenient and preferred method is to use the repository, since it allows auto-updating the analyzer upon releasing new versions. Another option is to use the installation package, which you can get here.
The installation commands differ depending on the Linux distro you are using. For instance, this is how installation from the repository under Debian-based systems looks like:
wget -q -O - https://files.viva64.com/etc/pubkey.txt | sudo apt-key add -

sudo wget -O /etc/apt/sources.list.d/viva64.list \
https://files.viva64.com/etc/viva64.list

sudo apt update
sudo apt install pvs-studio
To install PVS-Studio from the downloadable package, you can use the gdebi utility:
sudo gdebi pvs-studio-VERSION.debThe installation process is described in greater detail in the "Installing and updating PVS-Studio on Linux" documentation section. You can also find information on non-Debian systems there.
Once PVS-Studio is installed, you need to enter license data. Here's the command for that:
pvs-studio-analyzer credentials NAME KEY [-o LIC-FILE]NAME and KEY are the registered user name, and the license key respectively. The optional parameter –o allows you to specify the location, where a license file will be generated. By default, it will be stored in the ~/.config/PVS-Studio/ directory.
If you need a trial key, you can get it at the "Download and evaluate PVS-Studio" page.
Checking your project
Once you get the analyzer installed, you can start checking projects. There are two main ways to do this:
- Compilation monitoring.
- Running from build systems directly.
Let's talk about the first way. To launch the monitoring under Linux, you need the strace utility. PVS-Studio uses it to collect a list and parameters of processes, which were launched during the build.
Use the command below to initiate the build:
pvs-studio-analyzer trace -- makeHere, make is used, but any other command that you're running to build your project can be in its place. If needed, you can pass command-line parameters to it in the usual way.
After the build, strace will create a file, which the analyzer will then use to check the source code. To start the analysis, use the command below.
pvs-studio-analyzer analyze -o /path/to/project.logAs a result, an encoded log file will be generated, which you can convert to one of supported formats. We'll talk about working with reports later.
Besides strace, you can base the analysis on the compile_commands.json (JSON Compilation Database) file. Many build systems have built-in means of exporting compilation commands, or you could use the BEAR utility to do this. Here's the command to launch the analysis in this case:
pvs-studio-analyzer analyze –f /path/to/compile_commands.jsonNote that the analyzer recognizes the compiler, used in the build process, by its executable name. If you get the «No compilation units found» error whilst attempting to analyze your project, try explicitly specifying the name of your compiler via the –compiler or –c command-line key:
pvs-studio-analyzer analyze -c MyCompilerYou may need this if you're using cross-compilation, or if your compiler has a non-standard executable name.
Besides monitoring mode, you can integrate the analyzer directly into your build system or IDE. Our official GitHub repository provides example projects where the integration has already been configured:
- pvs-studio-cmake-examples
- pvs-studio-qmake-examples
- pvs-studio-makefile-examples
- pvs-studio-waf-examples
- pvs-studio-eclipse-examples
To learn more on running the analyzer under Linux, see the documentation.
Working with reports
After checking a project, the analyzer creates an encoded report. To convert it to one of supported formats, you need to use the plog-converter utility, which comes with the PVS-Studio installation.
Here's a list of supported formats:
- xml-a convenient format for further processing of the results of the analysis, which is supported supported by the plugin for SonarQube;
- csv — file stores tabular data (numbers and text) in plain text;
- errorfile is the output format of the gcc and clang;
- tasklist — an error format that can be opened in QtCreator;
- html — html report with a short description of the analysis results;
- fullhtml — report with sorting of the analysis results according to the different parameters and navigation along the source code.
The fullhtml format is the most convenient one for viewing the report, since it allows jumping to the line of code, corresponding to the warning you're interested in. The following command allows you to convert the report to this format:
plog-converter -a GA:1,2 -t fullhtml /path/project.log -o /path/report_dirWhen you launch it, a newly created directory named /path/report_dir will contain all the report files.
Pay attention to the -a parameter. It allows you to specify, which warnings should appear in the resulting report. It is convenient if you need to filter the analyzer's output. The above command will create a report, which will contain only general analysis messages of the first and second certainty levels (High and Medium).
An example report:
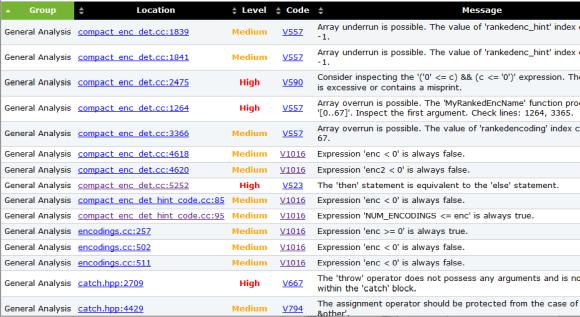
By clicking within a message's Location cell, you can jump to the corresponding line of code:
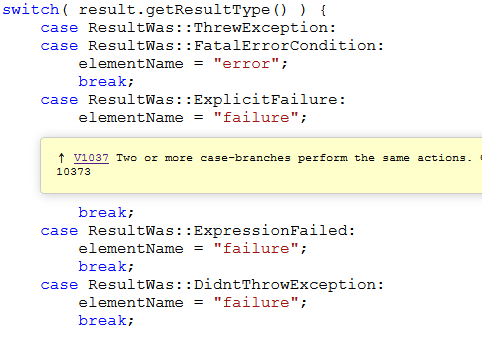
By clicking the diagnostic code in the Code column, you can open documentation on this diagnostic.
Suppressing analyzer warnings
When using any static analyzer to check source code, you might get false positives, or simply undesirable noise warnings. PVS-Studio has means of suppressing such messages. To target individual warnings, you can use one of the methods described in the "Suppression of false alarms" documentation article.
Also, when checking old code you might want to suppress all warnings. As a rule, you may need this if you only want to check new code that you add to an existing codebase. To do this, use the suppress parameter of the pvs-studio-analyzer utility.
You can mass-suppress warnings in a report by using this command:
pvs-studio-analyzer suppress /path/to/report.logInformation on suppressed warnings is stored in a file named suppress_base.json, which is located next to the project. Such messages are excluded from reports on subsequent checks.
This mechanism is described in detail here.
Conclusion
This was a brief introduction into using PVS-Studio under Linux. I hope it was useful and managed to answer the most frequent questions. If you need more information on the topic of this article, refer to documentation here.
