Have you ever needed to debug or profile an executable (.exe file) that you don’t have source for or can’t build? Then the least known Visual Studio project type, the EXE project, is for you!
In Visual Studio you can open any EXE as a ‘project’. Just go to File->Open->Project/Solution and browse to the .exe file. Like you would if it was a .sln file. Visual Studio will then open that EXE as a project. This feature has been around for a long time. It works on all currently supported Visual Studio versions and the docs for it are at ‘Debug an app that isn’t part of a Visual Studio solution‘.

This article in our blog.
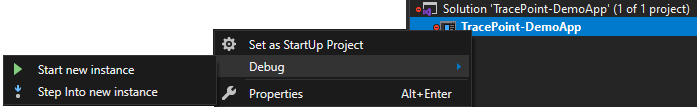
Just as with a normal project you can start debugging with F5, which will launch the EXE and attach the debugger. If you want to debug startup you can launch with F11, which will launch the EXE and stop on the first line of user code. Both of these options are available on the context menu for the EXE project in Solution Explorer window as illustrated below:
For debugging will need to have symbols, PDB files, for the EXE and any DLLs you need to debug. Visual Studio will follow the same process to try to obtain symbols as it does when debugging a normal project. Since it’s not likely that the PDB files were distributed alongside the EXE you might want to locate them from a build drop or, better yet, from a symbol server. More information and best practices for symbols can be found in this blog.
To effectively debug you’ll also need the source code that was used to build the EXE, even for just a few files that you care about. You’ll need to locate those files and open them in Visual Studio. If the source code isn’t the exact same as the source code that was built the EXE Visual Studio will warn you when you try to insert a breakpoint and the breakpoint won’t bind. That behavior can be overridden from the Breakpoint Settings peek window. In the settings peek window click on the Must match source link text and then check the box to allow mismatched source, as illustrated below. Of course, with mismatched source you never really know what’s going to happen, so use at your peril.

If the EXE was built with SourceLink enabled then information about the source will be included in the PDBs and Visual Studio will try to download the source automatically. This is a really good reason to use SourceLink with your projects. Even if you have a local enlistment you might not have the same version that was used to build the binary. SourceLink is your sure-fire way to make sure that the right source is linked with the right binary.
If you can’t obtain any source code you still have a couple of options:
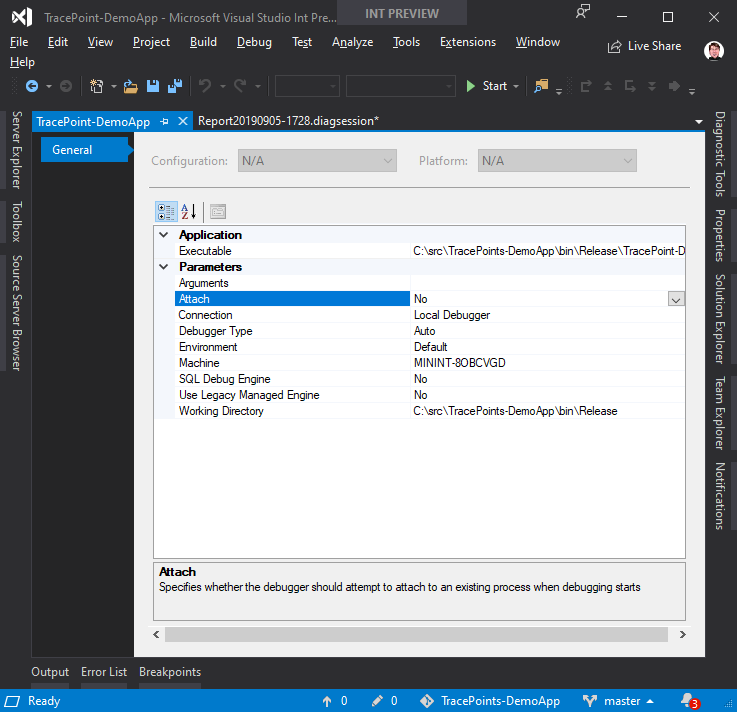
Lastly, if you need to pass in any arguments to the EXE that’s being debugged you can configure them along with other options in the Project Properties page (Right Click->Properties on the project node in solution explorer).
You can also use the profiling tools with the EXE by launching them from the Debug -> Performance Profiling. From the launch page of the profiling tools you can select what tools to use against the EXE. More information on profiling can be found in this docs (https://docs.microsoft.com/en-us/visualstudio/profiling/profiling-feature-tour?view=vs-2019).

That’s it. A brief overview of how you can use Visual Studio to debug and profile applications that you aren’t building and might not even have source for. So, next time you need to debug or profile an EXE don’t forget you can open it as a Solution in Visual Studio!
In Visual Studio you can open any EXE as a ‘project’. Just go to File->Open->Project/Solution and browse to the .exe file. Like you would if it was a .sln file. Visual Studio will then open that EXE as a project. This feature has been around for a long time. It works on all currently supported Visual Studio versions and the docs for it are at ‘Debug an app that isn’t part of a Visual Studio solution‘.
This article in our blog.
Debugging
Just as with a normal project you can start debugging with F5, which will launch the EXE and attach the debugger. If you want to debug startup you can launch with F11, which will launch the EXE and stop on the first line of user code. Both of these options are available on the context menu for the EXE project in Solution Explorer window as illustrated below:

For debugging will need to have symbols, PDB files, for the EXE and any DLLs you need to debug. Visual Studio will follow the same process to try to obtain symbols as it does when debugging a normal project. Since it’s not likely that the PDB files were distributed alongside the EXE you might want to locate them from a build drop or, better yet, from a symbol server. More information and best practices for symbols can be found in this blog.
To effectively debug you’ll also need the source code that was used to build the EXE, even for just a few files that you care about. You’ll need to locate those files and open them in Visual Studio. If the source code isn’t the exact same as the source code that was built the EXE Visual Studio will warn you when you try to insert a breakpoint and the breakpoint won’t bind. That behavior can be overridden from the Breakpoint Settings peek window. In the settings peek window click on the Must match source link text and then check the box to allow mismatched source, as illustrated below. Of course, with mismatched source you never really know what’s going to happen, so use at your peril.
If the EXE was built with SourceLink enabled then information about the source will be included in the PDBs and Visual Studio will try to download the source automatically. This is a really good reason to use SourceLink with your projects. Even if you have a local enlistment you might not have the same version that was used to build the binary. SourceLink is your sure-fire way to make sure that the right source is linked with the right binary.
If you can’t obtain any source code you still have a couple of options:
- Use a tool to decompile the assemblies back into C#, which you can recompile into new assemble to patch the old one.
- ILSpy is a great choice for this, but there’s plenty of other good paid and free tools out there.
- Use the Disassembly tool window in Visual Studio.
- The Source Not Found document has a link to view disassembly. Be warned, if you’re use to debugging C# code the disassembly view is a tool of last resort.
Lastly, if you need to pass in any arguments to the EXE that’s being debugged you can configure them along with other options in the Project Properties page (Right Click->Properties on the project node in solution explorer).

Profiling
You can also use the profiling tools with the EXE by launching them from the Debug -> Performance Profiling. From the launch page of the profiling tools you can select what tools to use against the EXE. More information on profiling can be found in this docs (https://docs.microsoft.com/en-us/visualstudio/profiling/profiling-feature-tour?view=vs-2019).
Conclusion
That’s it. A brief overview of how you can use Visual Studio to debug and profile applications that you aren’t building and might not even have source for. So, next time you need to debug or profile an EXE don’t forget you can open it as a Solution in Visual Studio!
