
Today we're going to discuss how small optimizations in the right places of the application can improve its performance. Imagine: we remove the creation of an extra iterator in one place, get rid of boxing in the other. As a result, we get drastic improvements because of such small edits.
One old and simple idea runs like a golden thread through the article. Please, remember it.
Premature optimizations are evil.
Sometimes it happens that optimization and readability go in slightly different directions. Code may work better, but it is harder to read and maintain. And vice versa — code is easy to read and modify but has some performance problems. Therefore, it is important to understand what we are willing to sacrifice in such cases.
A developer may read the article, rush to edit a project's code base and… get no performance improvements. And code becomes more complex.
That's why it is important to (always) approach the case with a cool head. It is great if you know your application's bottlenecks where optimization can help. Otherwise, various profilers are here to the rescue. They can provide a large amount of information about the application. In particular, describe its behavior in dynamics. For example, instances of what types are created the most frequently, how much time the application spends on garbage collection, how long a particular code fragment is executed etc. Two JetBrains tools are worth mentioning: dotTrace and dotMemory. They are convenient and collect a lot of information. Besides, it is perfectly visualized. JetBrains, you're cool!
But let's get back to the optimizations. Throughout the article we'll analyze several cases that we have faced and that seemed the most interesting. Each of described edits gave positive result, as it was made in the bottlenecks marked by the profilers. Unfortunately, I did not record the results of each change I made, but I'll show the general optimization result at the end of the article.
Note: This article is about working with .NET Framework. As experience shows (see the example with Enum.GetHashCode), sometimes the same C# code fragment may demonstrate a more optimal performance on .NET Core / .NET than on .NET Framework.
And what, in fact, are we optimizing?
The tips, described in the article, are relevant to every .NET application. Again, the edits are the most useful when done in the bottlenecks.
Beware that we are not going to delve into any abstract theoretical reasoning. In this context, the "change the code to avoid the creation of one iterator" type of tips would look bizarre. All the problems listed in this article were identified after I profiled the PVS-Studio static analyzer for C#. The main purpose of profiling was to reduce the analysis time.
After the work started, it quickly became clear that the analyzer had serious problems with garbage collection. It took a significant amount of time. In fact, we'd known this before, just made sure of it once again. By the way, earlier we had done several optimizations of the analyzer and we have a separate article on that.
However, the problem was still relevant.
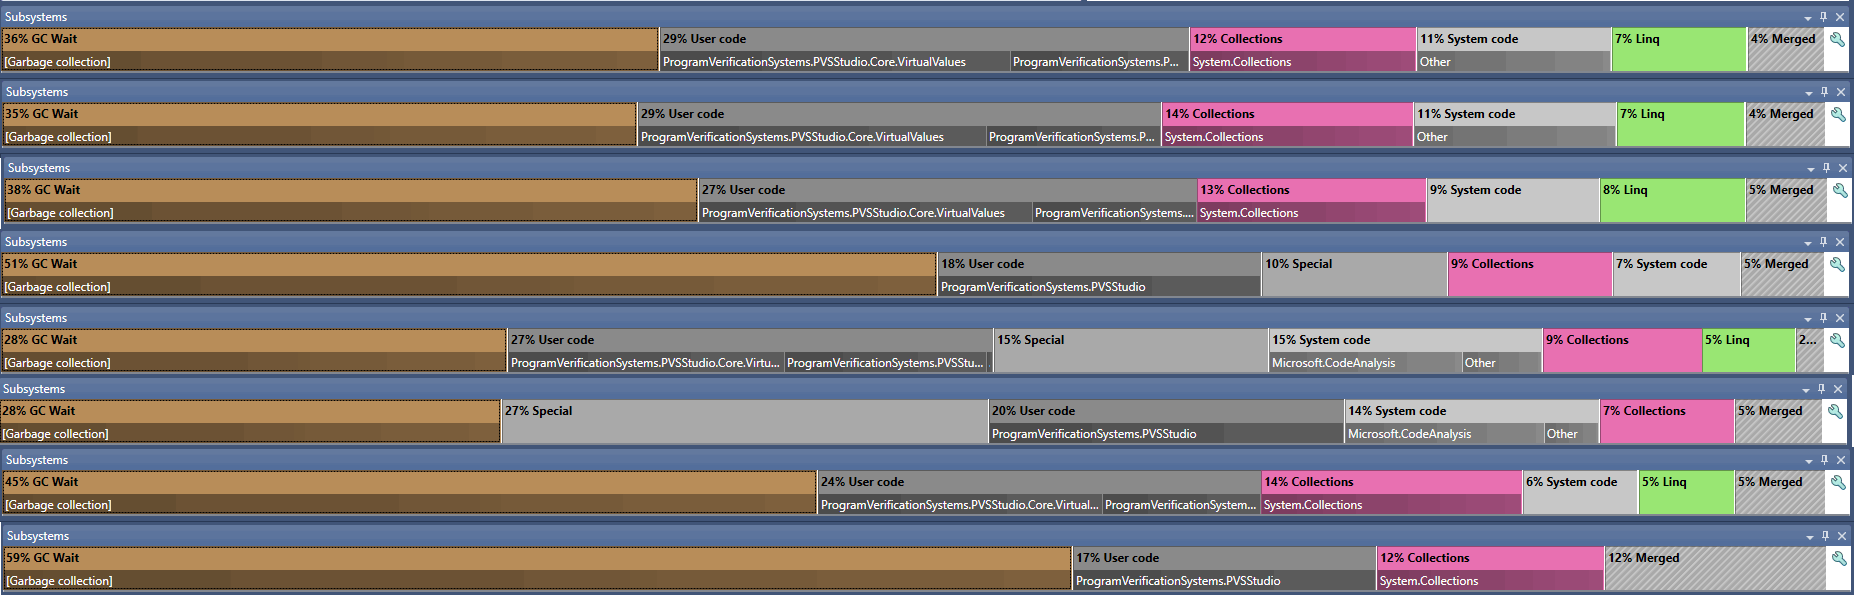
Look at the screenshot below (full-size image is here). This is the result I got after profiling the PVS-Studio C#. It used 8 threads — 8 lines in the screenshot. The garbage collection clearly took a significant time in each thread.

We rejected "rewrite everything in C" advice and got to work. In particular, we examined the results of the profiling and locally deleted unnecessary extra/temporary objects. To our luck, this approach immediately showed results.
This is going to be the main topic of the article.
What did we gain? Let's keep the intrigue until the end of the article.
Calling methods with a params parameter
Methods with a params parameter declared in their signature, can take the following as an argument:
- no values;
- one or more values.
For example, here is a method with a signature like this:
static void ParamsMethodExample(params String[] stringValue)Let's look at its IL code:
.method private hidebysig static void
ParamsMethodExample(string[] stringValue) cil managed
{
  .param [1]
  .custom instance void
  [mscorlib]System.ParamArrayAttribute::.ctor() = ( 01 00 00 00 )
  ....
}
This is a simple method with one parameter, marked with the System.ParamArrayAttribute. The strings array is specified as the parameter type.
Fun fact. The compiler issues the CS0674 error and forces you to use the params keyword — no way to use this attribute directly.
A very simple conclusion follows from the IL code. Each time we need to call this method, the caller code has to create an array. Well, almost.
Let's look at the following examples to better understand what's happening when you call this method with various arguments.
The first call is without arguments.
ParamsMethodExample()IL code:
call       !!0[] [mscorlib]System.Array::Empty<string>()
call       void Optimizations.Program::ParamsMethodExample(string[])
The method expects an array as input, so we need to get it somewhere. In this case we use a result of calling the static System.Array.Empty<T> method as an argument. This allows us to avoid creating empty collections and reduce the pressure on GC.
And now the sad part. Older versions of the compiler can generate different IL code. Like this:
ldc.i4.0
newarr     [mscorlib]System.String
call       void Optimizations.Program::ParamsMethodExample(string[])
In this case a new empty array is created every time we call a method that has no corresponding argument for the params parameter.
Time to test yourself. Do the following calls differ? If so, in what way?
ParamsMethodExample(null);

ParamsMethodExample(String.Empty);
Found an answer? Let's figure it out.
Let's start with the call when the argument is an explicit null:
ParamsMethodExample(null);IL code:
ldnull
call       void Optimizations.Program::ParamsMethodExample(string[])
The array is not created in this case. The method takes null as an argument.
Let's look at the case when we pass a non-null value to the method:
ParamsMethodExample(String.Empty);IL code:
ldc.i4.1
newarr     [mscorlib]System.String
dup
ldc.i4.0
ldsfld     string [mscorlib]System.String::Empty
stelem.ref
call       void Optimizations.Program::ParamsMethodExample(string[])
Here the code is already longer than in the previous example. An array gets created before calling the method. All the arguments, that had been passed to the method's params parameter, get into the array. In this case an empty string is written to the array.
Note that an array is also created if there are several arguments. It's created even if the arguments are explicit null values.
Thus, calling methods with the params parameters can play a trick on you if you do not expect the implicit array creation. In some cases the compiler can optimize the method call — remove the creation of an extra array. But overall, remember about temporary objects.
The profiler spotted several places where many arrays were created and collected by GC.
In the corresponding methods, the code looked approximately like this:
bool isLoop = node.IsKindEqual(SyntaxKind.ForStatement,
                               SyntaxKind.ForEachStatement,
                               SyntaxKind.DoStatement,
                               SyntaxKind.WhileStatement);
The IsKindEqual method looked like this:
public static bool IsKindEqual(this SyntaxNode node, params SyntaxKind[] kinds)
{
  return kinds.Any(kind => node.IsKind(kind));
}
We need to create an array to call the method. After we traverse the array, it becomes unnecessary.
Can we get rid of creating unnecessary arrays? Easy:
bool isLoop =    node.IsKind(SyntaxKind.ForStatement)
              || node.IsKind(SyntaxKind.ForEachStatement)
              || node.IsKind(SyntaxKind.DoStatement)
              || node.IsKind(SyntaxKind.WhileStatement);
This edit reduced the number of the temporary arrays needed — and eased the pressure on GC.
Note: Sometimes .NET libraries use a clever trick. Some methods with params parameters have overloads that take 1,2,3 parameters of the corresponding type instead of the params parameter. This trick helps avoid creating temporary arrays from the caller side.
Enumerable.Any<T>
We have seen many times the Any method call in the profiling results. What's wrong with it? Let's look at the real code: the IsKindEqual method we've mentioned earlier. Previously we placed more emphasis on the params parameter. Now let's take a closer look at the method's code from the inside.
public static bool IsKindEqual(this SyntaxNode node, params SyntaxKind[] kinds)
{
  return kinds.Any(kind => node.IsKind(kind));
}
To understand what the problem is with Any, we'll look "under the hood" of the method. We take the source code from our beloved referencesource.microsoft.com
public static bool Any<TSource>(this IEnumerable<TSource> source,
                                Func<TSource, bool> predicate)
{
  if (source == null)
    throw Error.ArgumentNull("source");

  if (predicate == null)
    throw Error.ArgumentNull("predicate");

  foreach (TSource element in source)
  {
    if (predicate(element))
      return true;
  }

  return false;
}
The foreach loopiterates through the original collection. If the predicate call has returned the true value for at least one element, then the result of the method's work is true. Otherwise, it's false.
The main problem is that any input collection is actually interpreted as IEnumerable<T>. Any optimizations for specific types of collections don't exist. A little reminder that we are working with an array in this case.
You may have already guessed that the main problem with Any is that it creates an excess iterator to traverse the collection. If you got a little lost — don't worry, we're going to figure it out.
Let's cut off the extra fragments of the Any method and simplify it. However, we'll save the necessary code: the foreach loop and the declaration of collection, with which the loop works.
Let's look at the following code:
static void ForeachTest(IEnumerable<String> collection)
{
  foreach (var item in collection)
    Console.WriteLine(item);
}
The IL code:
.method private hidebysig static void
ForeachTest(
  class
  [mscorlib]System.Collections.Generic.IEnumerable`1<string> collection)
cil managed
{
  .maxstack  1
  .locals init (
    [0] class
        [mscorlib]System.Collections.Generic.IEnumerator`1<string> V_0)

  IL_0000:  ldarg.0
  IL_0001:  callvirt   instance class
    [mscorlib]System.Collections.Generic.IEnumerator`1<!0> class
    [mscorlib]System.Collections.Generic.IEnumerable`1<string>::GetEnumerator()

  IL_0006:  stloc.0
  .try
  {
    IL_0007:  br.s       IL_0014

    IL_0009:  ldloc.0
    IL_000a:  callvirt   instance !0 class
      [mscorlib]System.Collections.Generic.IEnumerator`1<string>::get_Current()

    IL_000f:  call       void [mscorlib]System.Console::WriteLine(string)

    IL_0014:  ldloc.0
    IL_0015:  callvirt   instance bool
      [mscorlib]System.Collections.IEnumerator::MoveNext()

    IL_001a:  brtrue.s   IL_0009
    IL_001c:  leave.s    IL_0028
  }
  finally
  {
    IL_001e:  ldloc.0
    IL_001f:  brfalse.s  IL_0027

    IL_0021:  ldloc.0
    IL_0022:  callvirt   instance void
      [mscorlib]System.IDisposable::Dispose()

    IL_0027:  endfinally
  }
  IL_0028:  ret
}
See, a lot of things are happening here. Since the compiler doesn't know anything about the actual collection type, it has generated general-purpose code to iterate through the collection. The iterator is obtained by calling the GetEnumerator method (the IL_0001 label). If we obtain the iterator via the GetEnumerator method call, it will be created on the heap. All further interaction with the collection is based on the use of this object.
The compiler can use a special optimization while obtaining an iterator for an empty array. In this case, the GetEnumerator call doesn't create a new object. This topic deserves a separate note. In general case, don't count on this optimization.
Now let's change the code a little, so the compiler knows that we're working with the array.
C# code:
static void ForeachTest(String[] collection)
{
  foreach (var item in collection)
    Console.WriteLine(item);
}
The corresponding IL code:
.method private hidebysig static void
ForeachTest(string[] collection) cil managed
{
  // Code size       25 (0x19)
  .maxstack  2
  .locals init ([0] string[] V_0,
                [1] int32 V_1)
  IL_0000:  ldarg.0
  IL_0001:  stloc.0
  IL_0002:  ldc.i4.0
  IL_0003:  stloc.1
  IL_0004:  br.s       IL_0012
  IL_0006:  ldloc.0
  IL_0007:  ldloc.1
  IL_0008:  ldelem.ref
  IL_0009:  call       void [mscorlib]System.Console::WriteLine(string)
  IL_000e:  ldloc.1
  IL_000f:  ldc.i4.1
  IL_0010:  add
  IL_0011:  stloc.1
  IL_0012:  ldloc.1
  IL_0013:  ldloc.0
  IL_0014:  ldlen
  IL_0015:  conv.i4
  IL_0016:  blt.s      IL_0006
  IL_0018:  ret
}
The compiler generated simpler code since it knows the collection type we're working with. Besides, all the work with the iterator has disappeared — the object is not even created. We reduce the pressure on GC.
By the way, here's a "check yourself" question. If we restore C# code from this IL code, what kind of a language construction do we get? The code is obviously different from what was generated for the foreach loop earlier.
Here's the answer.
Below is the method in C#. The compiler will generate the same IL code as the one above, except for the names:
static void ForeachTest2(String[] collection)
{
  String[] localArr;
  int i;

  localArr = collection;

  for (i = 0; i < localArr.Length; ++i)
    Console.WriteLine(localArr[i]);
}
If the compiler knows that we're working with an array, it generates more optimal code by representing the foreach loop as the for loop.
Unfortunately, we lose such optimizations when working with Any. Besides, we create an excess iterator to traverse the sequence.
Lambda expressions
Lambdas are highly convenient things that make the developer's life so much easier. Until someone tries to put a lambda inside a lambda inside a lambda… Fans of doing that — please rethink this, seriously.
In general, the use of lambda expressions eases the developer's life. But don't forget that there are entire classes "under the hood" of a lambdas. This means, the instances of those classes still need to be created when your application uses lambdas.
Let's get back to the IsKindEqual method.
public static bool IsKindEqual(this SyntaxNode node, params SyntaxKind[] kinds)
{
  return kinds.Any(kind => node.IsKind(kind));
}
Now let's look at the corresponding IL code:
.method public hidebysig static bool
IsKindEqual(
  class
  [Microsoft.CodeAnalysis]Microsoft.CodeAnalysis.SyntaxNode
    node,
  valuetype
  [Microsoft.CodeAnalysis.CSharp]Microsoft.CodeAnalysis.CSharp.SyntaxKind[]
    kinds)
cil managed
{
  .custom instance void
    [mscorlib]System.Runtime.CompilerServices.ExtensionAttribute::
      .ctor() = ( 01 00 00 00 )
  .param [2]
  .custom instance void
    [mscorlib]System.ParamArrayAttribute::
      .ctor() = ( 01 00 00 00 )
  // Code size       32 (0x20)
  .maxstack  3
  .locals init
    (class OptimizationsAnalyzer.SyntaxNodeUtils/'<>c__DisplayClass0_0' V_0)
  IL_0000:  newobj     instance void
    OptimizationsAnalyzer.SyntaxNodeUtils/'<>c__DisplayClass0_0'::.ctor()
  IL_0005:  stloc.0
  IL_0006:  ldloc.0
  IL_0007:  ldarg.0
  IL_0008:  stfld
    class [Microsoft.CodeAnalysis]Microsoft.CodeAnalysis.SyntaxNode
    OptimizationsAnalyzer.SyntaxNodeUtils/'<>c__DisplayClass0_0'::node
  IL_000d:  ldarg.1
  IL_000e:  ldloc.0
  IL_000f:  ldftn      instance bool
    OptimizationsAnalyzer.SyntaxNodeUtils/'<>c__DisplayClass0_0'
      ::'<IsKindEqual>b__0'(
        valuetype [Microsoft.CodeAnalysis.CSharp]Microsoft.CodeAnalysis
                                                          .CSharp.SyntaxKind)
  IL_0015:  newobj     instance void
    class [mscorlib]System.Func`2<
      valuetype [Microsoft.CodeAnalysis.CSharp]
      Microsoft.CodeAnalysis.CSharp.SyntaxKind,bool>::.ctor(
        object, native int)
  IL_001a:  call       bool
    [System.Core]System.Linq.Enumerable::Any<
      valuetype [Microsoft.CodeAnalysis.CSharp]Microsoft.CodeAnalysis
                                                        .CSharp.SyntaxKind>(
         class [mscorlib]System.Collections.Generic.IEnumerable`1<!!0>,
         class [mscorlib]System.Func`2<!!0,bool>)
  IL_001f:  ret
}
There's a little more code here than in C#. Note instructions for creating objects on labels IL_0000 and IL_0015. In the first case, the compiler creates an object of the type that it generated automatically (under the lambda's "hood"). The second newobj call is the creation of the delegate instance that performs the IsKind check.
Bear in mind, that in some cases the compiler may apply optimizations and not add the newobj instruction to create the generated type instance. Instead, the compiler can, for example, create an object once, write it to a static field and continue working with this field. The compiler behaves this way when there are no captured variables in lambda expressions.
A rewritten IsKindEqual variant
Several temporary objects are created for every IsKindEqual call. As experience (and profiling) shows, sometimes this can play a significant role in terms of the pressure on GC.
One of the variants is to avoid the method at all. The caller can simply call the IsKind method several times. Another option is to rewrite the code.
The "before" version looks like this:
public static bool IsKindEqual(this SyntaxNode node, params SyntaxKind[] kinds)
{
  return kinds.Any(kind => node.IsKind(kind));
}
One of the possible 'after' versions looks like this:
public static bool IsKindEqual(this SyntaxNode node, params SyntaxKind[] kinds)
{
  for (int i = 0; i < kinds.Length; ++i)
  {
    if (node.IsKind(kinds[i]))
      return true;
  }

  return false;
}Note: You can rewrite the code with foreach. When the compiler knows that we are working with the array, it generates IL code of the for loop 'under the hood'.
As a result, we got a little more code, but we got rid of the temporary objects creation. We can see this by looking at IL code — all of the newobj instructions have disappeared.
.method public hidebysig static bool
IsKindEqual(class Optimizations.SyntaxNode node,
            valuetype Optimizations.SyntaxKind[] kinds) cil managed
{
  .custom instance void
    [mscorlib]System.Runtime.CompilerServices.ExtensionAttribute::
    .ctor() = ( 01 00 00 00 )
  .param [2]
  .custom instance void
    [mscorlib]System.ParamArrayAttribute::
    .ctor() = ( 01 00 00 00 )
  // Code size       29 (0x1d)
  .maxstack  3
  .locals init ([0] int32 i)
  IL_0000:  ldc.i4.0
  IL_0001:  stloc.0
  IL_0002:  br.s       IL_0015
  IL_0004:  ldarg.0
  IL_0005:  ldarg.1
  IL_0006:  ldloc.0
  IL_0007:  ldelem.i4
  IL_0008:  callvirt   instance bool
            Optimizations.SyntaxNode::IsKind(valuetype Optimizations.SyntaxKind)
  IL_000d:  brfalse.s  IL_0011
  IL_000f:  ldc.i4.1
  IL_0010:  ret
  IL_0011:  ldloc.0
  IL_0012:  ldc.i4.1
  IL_0013:  add
  IL_0014:  stloc.0
  IL_0015:  ldloc.0
  IL_0016:  ldarg.1
  IL_0017:  ldlen
  IL_0018:  conv.i4
  IL_0019:  blt.s      IL_0004
  IL_001b:  ldc.i4.0
  IL_001c:  ret
}
Redefining base methods in value types
Sample code:
enum Origin
{ }
void Foo()
{
  Origin origin = default;
  while (true)
  {
    var hashCode = origin.GetHashCode();
  }
}
Does this code exhibit pressure on GC? Okay-okay, given that the code is in the article, the answer is quite obvious.
Believed it? Everything is not that simple. To answer this question, we need to know if the application works on .NET Framework or .NET. By the way, how did the pressure on GC appear here at all? No objects seem to be created on the managed heap.
We had to look into IL code and read the specifications to understand the topic. I covered this issue in more detail in a separate article.
In short, here are some spoilers:
- Object boxing for the GetHashCode method call may take place;
- If you want to avoid the boxing, redefine the base methods in the value types.
Setting collections' initial capacity
Some people might say: "Why do we need to set the initial capacity of the collection, everything is already optimized under the "hood"". Of course, something is optimized (and we'll see what exactly). But let's talk about the application's places where creating almost every object can play a trick on us. Don't neglect the opportunity to tell the application the collection size you need.
Let's talk about why it is useful to set the initial capacity. We'll use the List<T> type as an example. Let's say we have the following code:
static List<Variable> CloneExample(IReadOnlyCollection<Variable> variables)
{
  var list = new List<Variable>();
  foreach (var variable in variables)
  {
    list.Add(variable.Clone());
  }

  return list;
}
Is it obvious what the problem is with this code? If yes — congratulations. If no, then let's figure it out.
We are creating an empty list and gradually filling it. Accordingly, every time the list runs out of capacity, we need:
- allocate memory for a new array, into which the list elements are added;
- copy the elements from the previous list to the new one.
Where's the array coming from? The array is the base of the List<T> type. Check referencesource.microsoft.com.
Obviously, the larger the size of the variables collection, the greater the number of such operations is performed.
The list growth algorithm in our case (for .NET Framework 4.8) is 0, 4, 8, 16, 32… I.e. if the variables collection has 257 elements, it requires 8 arrays to be created, and 7 copy operations.
You can avoid all of these unnecessary procedures if you set the list capacity at the beginning:
var list = new List<Variable>(variables.Count);Don't neglect that opportunity.
LINQ: miscellaneous
Enumerable.Count<T>
Depending on the overload, the Enumerable.Count method can:
- calculate the number of items in a collection;
- calculate the number of elements in the collections that satisfy a predicate.
Moreover, the method offers several optimizations… but there's a catch.
Let's look inside the method. We take the source code as usual, from referencesource.microsoft.com
The version that does not accept the predicate looks like this:
public static int Count<TSource>(this IEnumerable<TSource> source)
{
  if (source == null)
    throw Error.ArgumentNull("source");

  ICollection<TSource> collectionoft = source as ICollection<TSource>;
  if (collectionoft != null)
    return collectionoft.Count;

  ICollection collection = source as ICollection;
  if (collection != null)
    return collection.Count;

  int count = 0;
  using (IEnumerator<TSource> e = source.GetEnumerator())
  {
    checked
    {
      while (e.MoveNext()) count++;
    }
  }

  return count;
}
And here's the version with the predicate:
public static int Count<TSource>(this IEnumerable<TSource> source,
                                 Func<TSource, bool> predicate)
{
  if (source == null)
    throw Error.ArgumentNull("source");

  if (predicate == null)
    throw Error.ArgumentNull("predicate");

  int count = 0;
  foreach (TSource element in source)
  {
    checked
    {
      if (predicate(element))
        count++;
    }
  }

  return count;
}
Good news: the no-predicate version has an optimization that allows to efficiently calculate the number of elements for collections that implement ICollection or ICollection<T>.
However, if a collection does not implement any of these interfaces, the entire collection would be traversed to get the number of elements. This is especially interesting in the predicate method.
Suppose we have the following code:
collection.Count(predicate) > 12;And collection has 100 000 elements. Get it? In order to check this condition, it would have been enough for us to find 13 elements for which predicate(element) would return true. Instead, predicate is applied to all of the 100 000 elements in the collection. It becomes extremely inconvenient if predicate performs some relatively heavy operations.
There is a way out – go ahead and reinvent the wheel. Write your own Count analog(s). It's up to you to decide which method signature to make (and whether to make them at all). You can write several different methods. Or you can write a method with a tricky signature that would help determine which comparison you need ('>', '<', '==' etc). If you have identified Count-related bottlenecks, but there are only a couple of them – just use the foreach loop and rewrite them.
Any -> Count / Length
We have already determined that calling the Any method may require one extra iterator. We can avoid the creation of an extra object by using the specific collections' properties. List<T>.Count or Array.Length, for example.
For example:
static void AnyTest(List<String> values)
{
  while (true)
  {
    // GC
    if (values.Any())
      // Do smth

    // No GC
    if (values.Count != 0)
      // Do smth
  }
}
Such code is less flexible and maybe a little less readable. But at the same time, it might help avoid the creating of extra iterator. Yes, it might. Because this depends on whether the GetEnumerator method returns a new object. When I examined the issue more closely, I found some interesting moments. Maybe I'll write an article on them later.
LINQ -> loops
As experience shows, in places where each temporary object can slow performance, it makes sense to abandon LINQ in favor of simple loops. We've already talked about it when we reviewed examples with Any and Count. The same applies to other methods.
Example:
var strings = collection.OfType<String>()
                        .Where(str => str.Length > 62);

foreach (var item in strings)
{
  Console.WriteLine(item);
}
You can rewrite the code above like this:
foreach (var item in collection)
{
  if (item is String str && str.Length > 62)
  {
    Console.WriteLine(str);
  }
}
This is a primitive example where the difference is not very significant. Although there are also cases where LINQ queries are much easier to read than similar code in loops. So, bear in mind that it's a dubious idea to just abandon LINQ everywhere.
Note: If you have forgotten why LINQ causes the creation of objects on the heap, go through this video or this article.
Buffering LINQ requests
Don't forget that every time you traverse a sequence, LINQ queries with deferred calculation are executed all over again.
The following example clearly demonstrates this:
static void LINQTest()
{
  var arr = new int[] { 1, 2, 3, 4, 5 };

  var query = arr.Where(AlwaysTrue);

  foreach (var item in query) // 5
  { /* Do nothing */}

  foreach (var item in query) // 5
  { /* Do nothing */}

  foreach (var item in query) // 5
  { /* Do nothing */}

  bool AlwaysTrue(int val) => true;
}
In this case the AlwaysTrue method is executed 15 times. At the same time if we had buffered the request (added the ToList method call to the LINQ call chain), the AlwaysTrue method would have been called only 5 times.
Changing the garbage collection mode
I have mentioned above that we have already done a number of optimizations in the PVS-Studio C# analyzer. We even wrote an article about that. After publishing it on habr.com, the article prompted a heated discussion in the comments. One of the suggestions was to change the garbage collector settings.
Can't say we didn't know about them. Moreover, when I was doing optimizations and reading a book "Pro .NET Performance: Optimize Your C# Applications", I also read about the GC settings. But somehow I didn't catch on to the fact that changing the garbage collection mode can bring any benefits. My bad.
During my vacation, my colleagues did a very cool thing: they took the advice from the comments and decided to try altering the GC working mode. The result was impressive — the time that PVS-Studio C# required to analyze big projects (like Roslyn) was significantly reduced. At the same time, PVS-Studio used up more memory when analyzing small projects, but that was acceptable.
After we altered the GC working mode, the analysis time decreased by 47%. Before, the analysis on this machine took 1 hour and 17 minutes. After — only 41 minutes.

I was excited to see Roslyn analysis take under 1 hour.
We were so pleased with the results that we included the new (server) garbage collection mode in the C# analyzer. This mode will be enabled by default starting from the PVS-Studio 7.14.
Sergey Tepliakov described the different garbage collection modes in more detail in this article.
PVS-Studio C# analyzer optimization results
We have made a number of other optimizations.
For example:
- we got rid of the bottlenecks in some diagnostics (and rewrote one);
- we optimized the objects used in data-flow analysis: simplified copying, included additional caching, eliminated temporary objects on the managed heap;
- optimized the comparison of tree nodes;
- etc.
We began to add all these optimizations slowly, starting from the PVS-Studio version 7.12. By the way, during this time, we also added new diagnostics, .NET 5 support, and taint analysis.
For the sake of curiosity, I measured the analysis time of our open-source projects from out tests using PVS-Studio 7.11 and 7.14. I compared the analysis results of the projects that PVS-Studio took the longest to process.
On the graph below, you can see the analysis time (in minutes):
- the Juliet Test Suite project;
- the Roslyn project;
- the total time of analysis of all projects from the tests.
The graph itself:

The increase in performance is clearly very significant. So, if you're not content with the operating speed of PVS-Studio for C#, come try again. By the way, you can get an extended trial version for 30 days – just follow the link :)
If you encounter any problems — contact our support, we will sort it out.
Conclusion
Premature optimization is evil. Long live optimization based on profiling results! And remember that every small change in the right place of a reusable block of code can drastically affect performance.
As always, subscribe to my Twitter so as not to miss anything interesting.
