In May 2021, CppCast recorded a podcast called ABI stability (CppCast #300). In this podcast, Marshall Clow and the hosts discussed rather old news — Visual Studio compilers support the AddressSantitzer tool. We have already integrated ASan into our testing system a long time ago. Now we want to tell you about a couple of interesting errors it found.

Text broadcast of Cppcast 300 is here.
AddressSanitizer is one of the dynamic analysis modules from LLVM's compiler-rt. ASan "catches" errors or incorrect memory usage. For example: going beyond the boundaries of allocated memory, using freed memory, double or incorrect memory releases. In the PVS-Studio blog, we write about static analysis for obvious reasons. However, we cannot ignore how useful dynamic analysis is for monitoring programs' correctness.
Introduction
A few words about how we test the C++ analyzer. On the build server, during the night run, the analyzer goes through several testing stages:
- Various compilers (MSVC, GCC, Clang) check the buildability of the pvs-studio core, the pvs-studio-analyzer, and the plog-converter utilities. The compilers check them in various configurations, like Debug or Release, for Windows, Linux and macOS.
- Unit and integration tests check both test code fragments and utility usage scenarios. The tests are based on the GoogleTest framework.
- A special program runs the C++ analyzer through a selection of open-source projects on all supported platforms. We call this program SelfTester. SelfTester runs the analyzer for a project and compares the run result with reference results.
- PVS-Studio runs a static "introspection" for itself. By the way, we are frequently asked in articles and conferences if PVS-Studio analyzes itself.
- Unit and integration tests run dynamic analysis.
The developers also run the first four stages locally on their machines.
In fact, we have been using dynamic analysis for more than 5 years on Linux. We first added it when we ported PVS-Studio on Linux. Can never have too many tests, right? Since the project code in our test base significantly differs from one OS to another, we decided to additionally run dynamic analysis on Windows. Plus, the analyzer's code is slightly different for every system.
Does PVS-Studio have errors?
Errors do not exist until proven otherwise. Joking. As doctors say: "There are no healthy people, there are under-examined ones". The same thing goes with software development. One day your tools cheerfully report that everything's fine. Then the other day you try something new or update something old — and ask yourself a question: "How could your code even work before?" Unfortunately, we are no exception. But this is the way it is, and this is normal.

On a serious note, both static and dynamic analysis have their own strengths and weaknesses. And there's no point in trying to choose one thing. They complement each other perfectly. As you see, we use both static and dynamic analysis to check the PVS-Studio code. And further in this article, we will show you the benefits of diversity.
Debugging tools from the standard library
Before proceeding directly to ASan, I'll point out one useful setting. This setting is also a dynamic analysis mechanism and is already at hand. We note this setting because without it the project with ASan is not going to be built. We are talking about checks built into the compiler's standard library implementation. In MSVS debugging mode, the following macros are enabled by default: _HAS_ITERATOR_DEBUGGING=1, _ITERATOR_DEBUG_LEVEL=2 and _SECURE_SCL=1. During the program check, these macros activate checking for incorrect handling of iterators and other standard library classes. Such checks allow you to catch many trivial mistakes made accidentally.
However, a lot of checks can get in the way, drastically slowing down the debugging process. That's why developers usually have them turned off and turn on at night on the test server. Well, that was on paper. In fact, this setting disappeared from the test run script on the Windows server… Accordingly, when we set up the project for the sanitizer, a pack of accumulated surprises surfaced:

For example, those MessageBox messages occurred due to incorrect initialization of a variable of the std::optional type:

If the StringToIntegral function couldn't parse the number which controls the enabled diagnostic groups, it will return std::nullopt. After that the code needs to obtain the group by converting the letter code. However, a developer put an extra asterisk in the groupIndicator value reset expression. Thus, we got undefined behavior because an accessor was called on an uninitialized std::optional. This is like null pointer dereference.

Another problem with std::optional was incorrect logic of processing array size "virtual values":
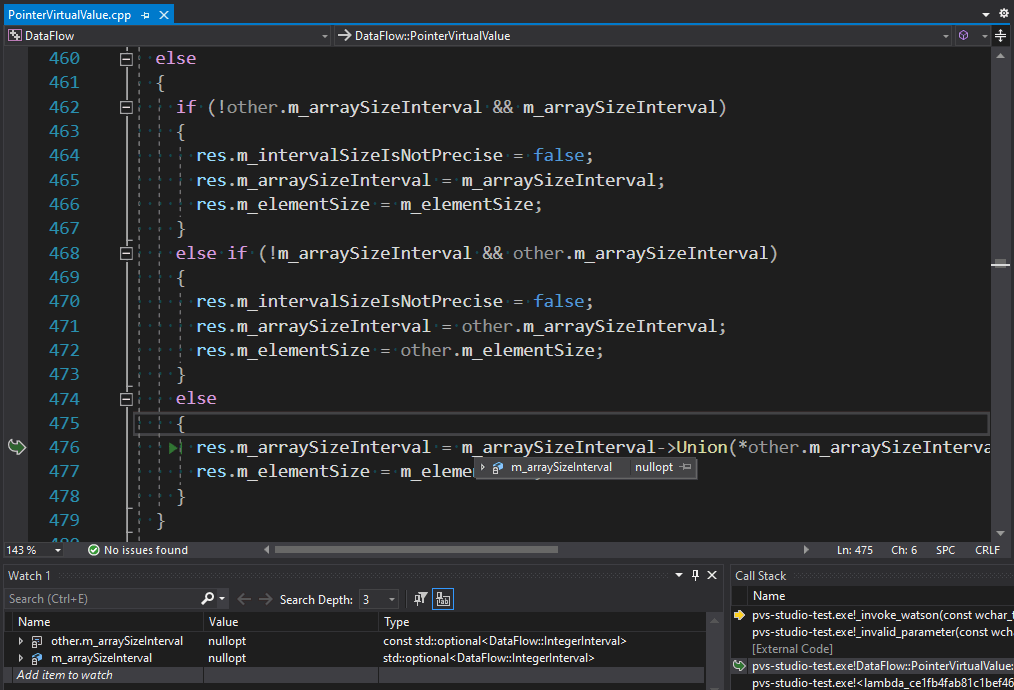
Here the virtual values obtained by combining the code execution paths are merged. Term "virtual value" means a certain range of values, where a value of a variable in the corresponding program place falls into. If we managed to determine the values on both execution branches (both values don't contain std::nullopt), we call the Union method. If the value is unknown on one of the execution paths, you need to set it to a known value from another branch. But the original algorithm was not designed for the scenario when both execution branches produce unknown values. The algorithm still calls the Union method for them, as if both values were known. This causes a problem similar to the one in the previous example. See the fixed code fragment below – it does nothing when both values are unknown:
if (other.m_arraySizeInterval && m_arraySizeInterval)
{
  res.m_arraySizeInterval = m_arraySizeInterval
                            ->Union(*other.m_arraySizeInterval);
  res.m_elementSize = m_elementSize;
}
else if (!other.m_arraySizeInterval && m_arraySizeInterval)
{
  res.m_intervalSizeIsNotPrecise = false;
  res.m_arraySizeInterval = m_arraySizeInterval;
  res.m_elementSize = m_elementSize;
}
else if (!m_arraySizeInterval && other.m_arraySizeInterval)
{
  res.m_intervalSizeIsNotPrecise = false;
  res.m_arraySizeInterval = other.m_arraySizeInterval;
  res.m_elementSize = other.m_elementSize;
}
The following failed test shows an example of refactoring consequences:
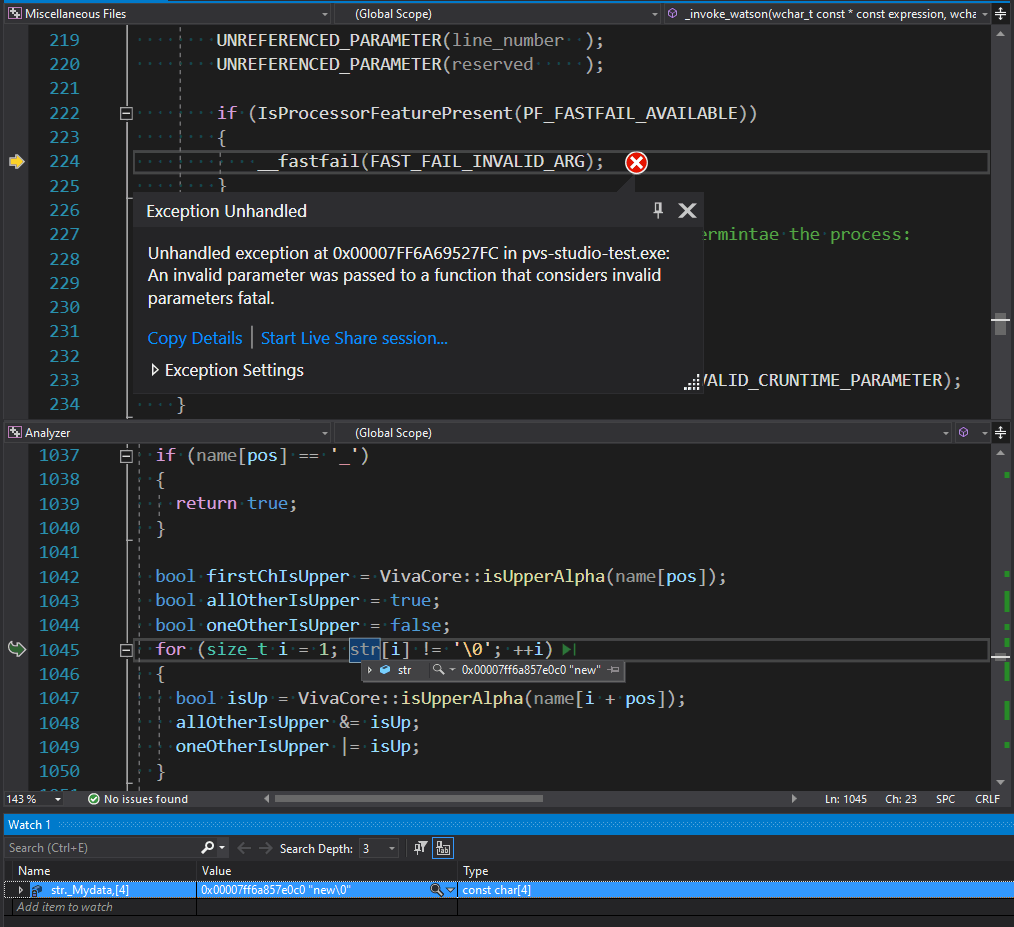
Once the str variable had been a simple pointer to a character array, that obviously ended with a null terminal. Then str was replaced with std::string_view without including a null terminal. However, not all places, where this variable is used, were changed to use std::string_view. In this code fragment, the algorithm that processes the string's contents, continues to search for its end, expecting a null terminal. Technically, there is no error (not counting an unnecessary iteration) since there's a zero in memory at the end of the string. But there's no guarantee that this zero at the end of the string is going to be there forever. So, let's limit the loop with the size method:
for (size_t i = 1; i < str.size(); ++i)
{
  bool isUp = VivaCore::isUpperAlpha(name[i + pos]);
  allOtherIsUpper &= isUp;
  oneOtherIsUpper |= isUp;
}
Another example of going beyond the string boundary looks like incorrect behavior. We found it in the V624 diagnostic, that checks the accuracy of writing some constants and suggests replacing them with more accurate analogues from the standard library:
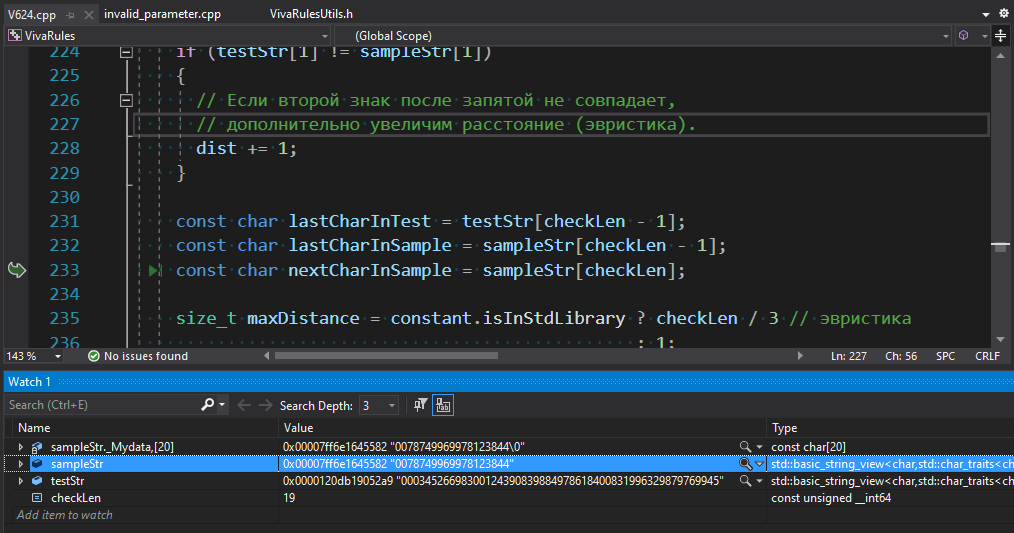
From the sampleStr string, we get a character at the checkLen index. The character should be a digit from a numeric literal. However, in this case, the index points to a null terminal. The index is obtained the following way:
const size_t maxDigits = 19;
size_t n; // Numbers after dot to check

switch (literalType)
{
case ST_FLOAT:
  n = 6;
  break;
case ST_DOUBLE:
  n = 14;
  break;
default:
  n = maxDigits;
}

const size_t checkLen = min(n, testStr.length());          // <=
size_t dist = GetEditDistance(testStr.substr(0, checkLen),
                              sampleStr.substr(0, checkLen));
The checkLen value is set depending on the type of a floating-point constant and the length of a string with the reference value of the constant. This does not take into account the length of the numeric literal of the constant being checked. As a result, the diagnostic may work incorrectly on short numbers. The correct code fragment:
const size_t checkLen = min(n, min(sampleStr.size() - 1, testStr.size()));The last error, found on checks from the standard library, was in the V1069 diagnostic. This diagnostic looks for concatenation of different types of string literals.
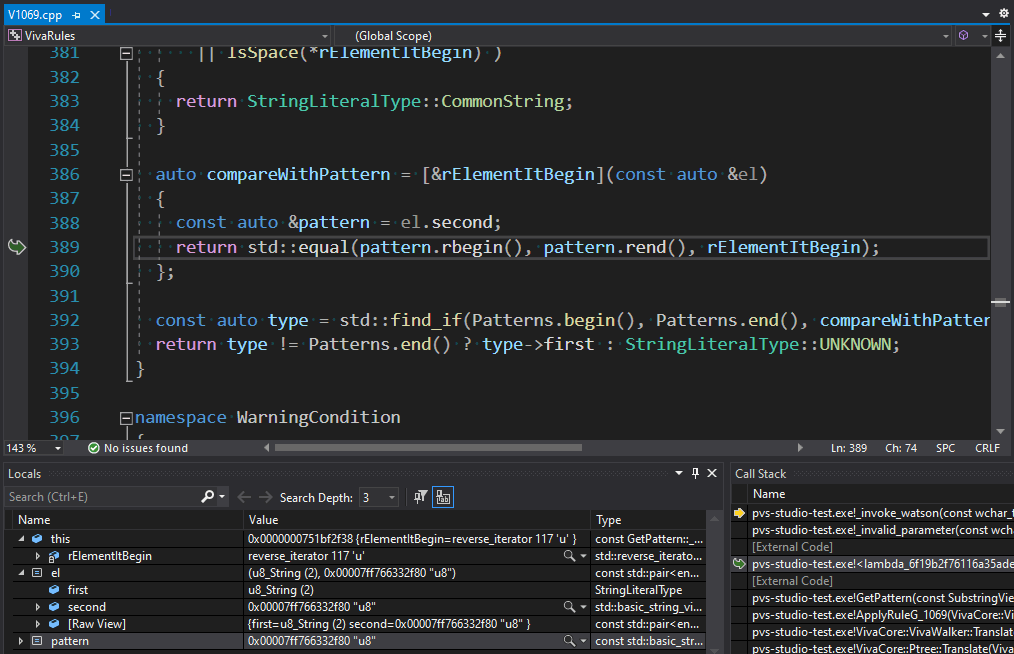
The compareWithPattern lambda uses std::equal to compare prefixes of the string literal fragments. The comparison takes place backwards (it is necessary!) via reversed iterators. The problem here is that the used overload of the std::equal algorithm compares the inclusion of elements of one container in another element-by-element. It doesn't check the containers' length in advance. This overload just goes through an iterator until it hits the final iterator of the first container. If the first container is longer than the second one, we get going beyond the second container's boundary. In our case, we looked for the "u8" substring in the "u" prefix. To ensure that we don't go beyond containers' boundaries, we can use the correct overload. It checks the end iterators of both containers. But std::equal returns true, even if the containers have different lengths and their elements match. That's why we need to use std::mismatch and check both resulting iterators:
StringLiteralType GetPattern(const SubstringView& element)
{
  auto rElementItBegin = element.RBeginAsString();
  auto rElementItEnd = element.REndAsString();

  .... // 'rElementItBegin' modification

  const auto compareWithPattern =
  [&rElementItBegin, &rElementItEnd](const auto &el)
  {
    const auto &pattern = el.second;
    auto [first, second] = std::mismatch(pattern.rbegin(), pattern.rend(),
                                         rElementItBegin, rElementItEnd);
    return first == pattern.rend() || second == rElementItEnd;
  };

  const auto type = std::find_if(Patterns.begin(), Patterns.end(),
                                 compareWithPattern);
  return type != Patterns.end() ? type->first : StringLiteralType::UNKNOWN;
}
This was the last error asserts found.

Where's ASan?
All previous tests were performed with ASan enabled. However, it did not issue any warnings there. The checks from the standard library on Linux didn't show them either, which is weird.
To enable AddressSanitizer for your project, install the corresponding component in Visual Studio first.

The standard library checks should be enabled in the Debug configuration (they are not needed in the Release configuration). Besides, we need to add the /fsanitize=address compilation flag in the project properties.
We can easily enable the /fsanitize=address flag via the CMake script, but we need to remove the conflicting /RTC flags from the compiler:
if (PVS_STUDIO_ASAN)
  if (MSVC)
    add_compile_options(/fsanitize=address)
    string(REGEX REPLACE "/RTC(su|[1su])" ""
           CMAKE_CXX_FLAGS_DEBUG "${CMAKE_CXX_FLAGS_DEBUG}")
  endif ()
endif ()
Since we corrected small tests – it's time for the "heavy artillery". Let's build the core in the Release configuration, with ASan enabled, and run SelfTester.
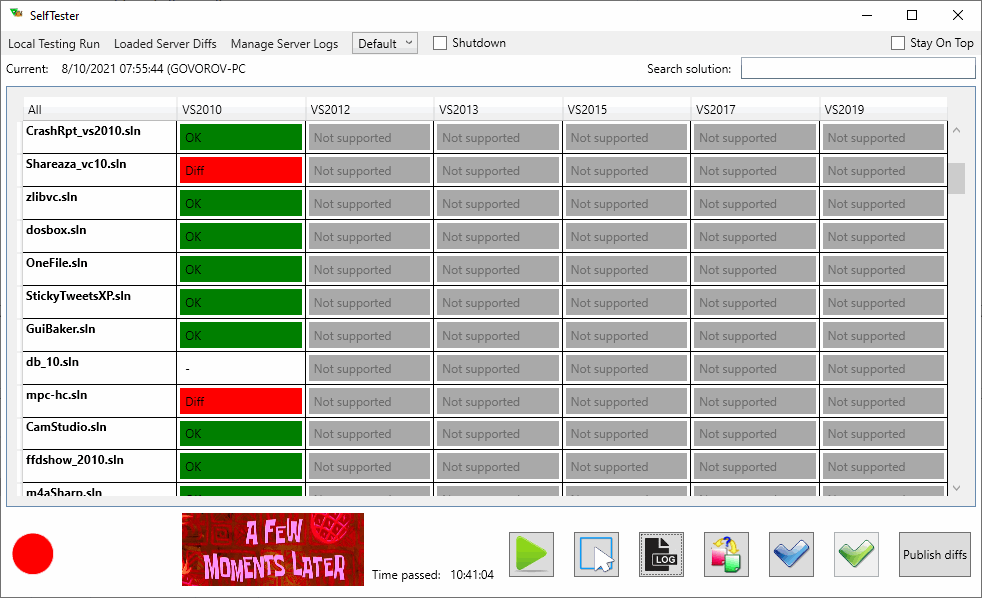
Okay, the testing took 10 times longer than testing a regular core. One of the projects timed out and failed after 5 hours. When we ran this project separately, we didn't find any problems. You can't push it into a night run, but: "Obviously it's doing something!" :) As a result, ASan found 2 same mistakes in 6 different files.
ASan crashes the program when it detects an error. Before that it outputs the call stack, so we can understand where this error happened:

The V808 diagnostics accessed out of memory buffer somewhere. This diagnostic warns that some object was created and then not used. We started debugging the core with ASan enabled, passing the .cfg file, on which the crash occurred, to the core. Then we waited. We didn't expect to find this type of a bug.

The V808 diagnostic has one exception: characters passed to the __noop(....) function of the MSVC compiler do not trigger it. Someone considered processing this operation as an ordinary function call unnecessary. So, during the source code parsing, the parser just creates a leaf node of the tree. Roughly speaking, it's std::string_view. The V808 diagnostic parses its contents separately. Due to an error inside the parser, the algorithm that generates the leaf for __noop, determined the end of the construction incorrectly — and captured extra code. This __noop was close to the end of the file. So, when the algorithm constructed a string from the pointer and the leaf length, ASan issued a warning about going beyond the file boundary. Great catch! After we fixed the parser, the analyzer showed some additional warnings on the code fragment behind __noop functions. We had only one such issue in our test base.
The last error dynamic analysis helped us find was related to the use of freed memory:
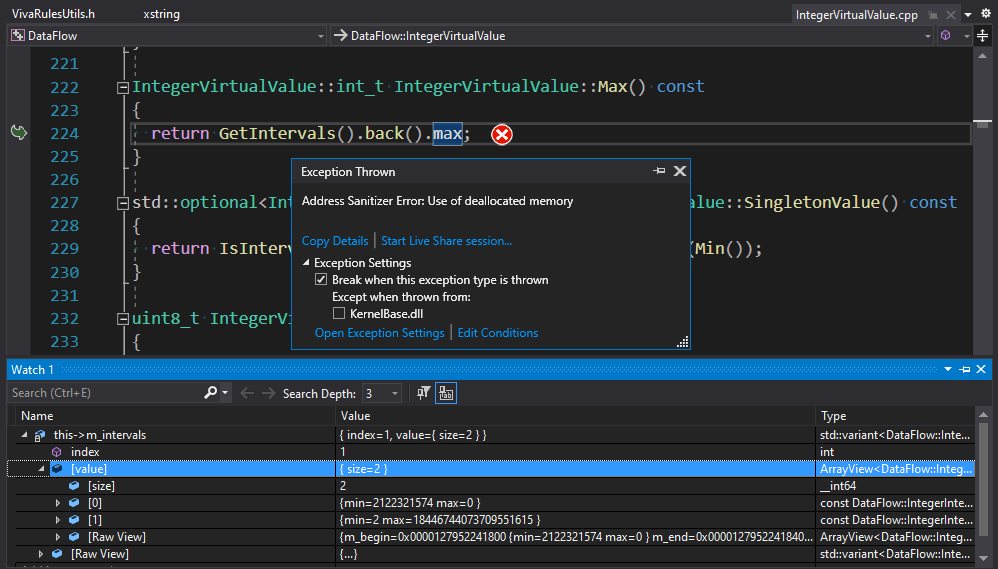
One of the techniques that we use to analyze programs is data-flow analysis.
During the expression analysis, the data flow analyzer allocates special stores — Pools — for storing virtual values. When data-flow analysis goes to another context to calculate a subexpression or another execution block, it saves the previous Pool and creates a new active Pool. Accordingly, when data-flow analysis finishes processing the current context, it releases its Pool and restores the previous context.
pair<optional<IntegerVirtualValue>, optional<IntegerVirtualValue>>
PreciseListVirtualValue::SizeFromCondition(
  BinaryOperator op,
  const IntegerVirtualValue& value,
  const IntegerInterval &sizeInterval) const
{
  Pool pool{};
  pair<optional<IntegerVirtualValue>, optional<IntegerVirtualValue>> res;
  auto length = GetLengthVirtual()
                .value_or(IntegerVirtualValue(sizeInterval, false));
  ....

  auto getResForCond = [](const VirtualValueOpt& value)
    -> std::optional<IntegerVirtualValue>
  {
    if (!value)
    {
      return nullopt;
    }

    if (const IntegerVirtualValue *val = get_if<IntegerVirtualValue>(&*value))
    {
      return *val;                         // <=
    }

    return nullopt;
  };
  ....

  switch (op)
  {
    case .... :
      // for example
      res.first = getResForCond(length.Intersection(pool, value));
      res.second = getResForCond(length.Complement(pool, value));
    ....
  }

  return { res.first, res.second };
}
A wrapper over virtual value references is created in the getResForCond lambda. Then the references are processed depending on the operation type in the switch statement. The SizeFromCondition function exits, the wrapper is returned, and the references inside it continue to point to the values from the pool deleted via RAII. To fix the code, we need to return copies of objects, not references. In this case we were lucky: the cause of the error and its consequence were close to each other. Otherwise, it would have been a long and painful debugging.
Conclusion
Dynamic analysis is a powerful tool. Its main advantage is the fundamental absence of false positives. For example, if ASan warns about going beyond the buffer boundary, then it happened during execution with the specified source data. Except for the butterfly effect (when the problem occurs at the beginning of the program execution, and manifests itself much later), debugging will have enough information about what happened and where to fix the error.
Unfortunately, this also works in the opposite direction. If an error is possible, but the program's execution successfully walked along the edge, then ASan stays silent, i.e. dynamic analysis cannot show potential errors. It is possible to write tests that check all borderline cases in some programs. However, for PVS-Studio, it means building a code base that contains all possible programs in C++.
You can read more about pros and cons of dynamic analysis in the following article: "What's the use of dynamic analysis when you have static analysis?"