
Задача и требования
Основная цель - создать алгоритм, который найдет максимальное значение по модулю минимума на заданном радиусе.
Алгоритм должен быть эффективным и работать достаточно быстро
Результат должен быть отображен на графике
Введение, описание алгоритма
Рабочая область функции (заданный интервал) разбита на несколько точек. Выбраны точки локальных минимумов. После этого все координаты передаются функции в качестве аргументов и выбирается аргумент, дающий наименьшее значение. Затем применяется метод градиентного спуска.
Реализация
Прежде всего, numpy необходим для функций sinus, cosinus и exp. Также необходимо добавить matplotlib для построения графиков.
import numpy as np
import matplotlib.pyplot as plot
Константы
radius = 8                                  # working plane radius
centre = (global_epsilon, global_epsilon)   # centre of the working circle
arr_shape = 100                             # number of points processed / 360
step = radius / arr_shape                   # step between two points
arr_shape должна быть 100, потому что, если она больше, программа начинает работать значительно медленнее. И не может быть меньше, иначе это испортит расчеты.
Функция, для которой рассчитывается минимум:
def differentiable_function(x, y):
    return np.sin(x) * np.exp((1 - np.cos(y)) ** 2) + \
           np.cos(y) * np.exp((1 - np.sin(x)) ** 2) + (x - y) ** 2
Затем выбирается приращение аргумента:
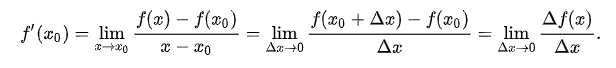
Поскольку предел аргумента стремится к нулю, точность должна быть небольшой по сравнению с радиусом рабочей плоскости:
global_epsilon = 0.000000001 # argument increment for derivative
Для дальнейшего разбиения плоскости необходим поворот вектора:
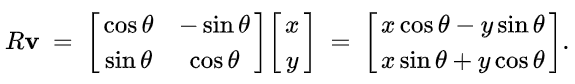
Если вращение применяется к вектору (x, 0), повернутый вектор будет вычисляться следующим образом:
def rotate_vector(length, a):
    return length * np.cos(a), length * np.sin(a)
Расчет производной по оси Y, где эпсилон - значение y:
def derivative_y(epsilon, arg):
    return (differentiable_function(arg, epsilon + global_epsilon) -

        differentiable_function(arg, epsilon)) / global_epsilon
Вычисление производной по оси X, где эпсилон - значение x:
def derivative_x(epsilon, arg):
    return (differentiable_function(global_epsilon + epsilon, arg) -

         differentiable_function(epsilon, arg)) / global_epsilon
Расчет градиента:

Поскольку градиент вычисляется для 2D-функции, k равно нулю
gradient = derivative_x(x, y) + derivative_y(y, x)
Схема генерации точек

Возвращаемое значение представляет собой массив приблизительных локальных минимумов.
Локальный минимум распознается по смене знака производной с минуса на плюс. Подробнее об этом здесь: https://en.wikipedia.org/wiki/Maxima_and_minima
def calculate_flip_points():
    flip_points = np.array([0, 0])
    points = np.zeros((360, arr_shape), dtype=bool)
    cx, cy = centre

    for i in range(arr_shape):
        for alpha in range(360):
            x, y = rotate_vector(step, alpha)
            x = x * i + cx
            y = y * i + cy
            points[alpha][i] = derivative_x(x, y) + derivative_y(y, x) > 0
            if not points[alpha][i - 1] and points[alpha][i]:
                flip_points = np.vstack((flip_points, np.array([alpha, i - 1])))

    return flip_points
Выбор точки из flip_points, значение функции от которой минимально:
def pick_estimates(positions):
    vx, vy = rotate_vector(step, positions[1][0])
    cx, cy = centre
    best_x, best_y = cx + vx * positions[1][1], cy + vy * positions[1][1]

    for index in range(2, len(positions)):
        vx, vy = rotate_vector(step, positions[index][0])
        x, y = cx + vx * positions[index][1], cy + vy * positions[index][1]
        if differentiable_function(best_x, best_y) > differentiable_function(x, y):
            best_x = x
            best_y = y

    for index in range(360):
        vx, vy = rotate_vector(step, index)
        x, y = cx + vx * (arr_shape - 1), cy + vy * (arr_shape - 1)
        if differentiable_function(best_x, best_y) > differentiable_function(x, y):
            best_x = x
            best_y = y

    return best_x, best_y
Метод градиентного спуска:
def gradient_descent(best_estimates, is_x):
    derivative = derivative_x if is_x else derivative_y
    best_x, best_y = best_estimates
    descent_step = step
    value = derivative(best_y, best_x)

    while abs(value) > global_epsilon:
        descent_step *= 0.95
        best_y = best_y - descent_step \
            if derivative(best_y, best_x) > 0 else best_y + descent_step
        value = derivative(best_y, best_x)

    return best_y, best_x
Нахождение точки минимума:
def find_minimum():
    return gradient_descent(gradient_descent(pick_estimates(calculate_flip_points()), False), True)
Формирование сетки точек для построения:
def get_grid(grid_step):
    samples = np.arange(-radius, radius, grid_step)
    x, y = np.meshgrid(samples, samples)

return x, y, differentiable_function(x, y)
Построение графика:
def draw_chart(point, grid):
    point_x, point_y, point_z = point
    grid_x, grid_y, grid_z = grid
    plot.rcParams.update({
        'figure.figsize': (4, 4),
        'figure.dpi': 200,
        'xtick.labelsize': 4,
        'ytick.labelsize': 4
    })
    ax = plot.figure().add_subplot(111, projection='3d')
    ax.scatter(point_x, point_y, point_z, color='red')
    ax.plot_surface(grid_x, grid_y, grid_z, rstride=5, cstride=5, alpha=0.7)

plot.show()
Функция main:
if __name__ == '__main__':
    min_x, min_y = find_minimum()
    minimum = (min_x, min_y, differentiable_function(min_x, min_y))

draw_chart(minimum, get_grid(0.05))
График:
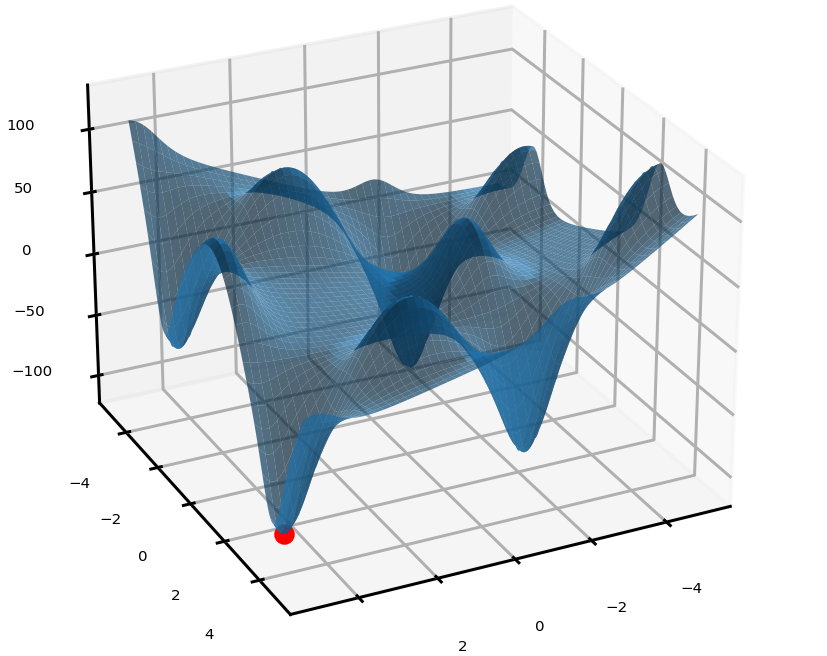
Заключение
Процесс вычисления минимального значения с помощью алгоритма может быть не очень точным при вычислениях в более крупном масштабе, например, если радиус рабочей плоскости равен 1000, но он очень быстрый по сравнению с точным. Плюс в любом случае, если радиус большой, результат находится примерно в том положении, в котором он должен быть, поэтому разница не будет заметна на графике.
Исходный код:
import numpy as np
import matplotlib.pyplot as plot


radius = 8                                  # working plane radius
global_epsilon = 0.000000001                # argument increment for derivative
centre = (global_epsilon, global_epsilon)   # centre of the working circle
arr_shape = 100                             # number of points processed / 360
step = radius / arr_shape                   # step between two points


def differentiable_function(x, y):
    return np.sin(x) * np.exp((1 - np.cos(y)) ** 2) + \
           np.cos(y) * np.exp((1 - np.sin(x)) ** 2) + (x - y) ** 2


def rotate_vector(length, a):
    return length * np.cos(a), length * np.sin(a)


def derivative_x(epsilon, arg):
    return (differentiable_function(global_epsilon + epsilon, arg) -
            differentiable_function(epsilon, arg)) / global_epsilon


def derivative_y(epsilon, arg):
    return (differentiable_function(arg, epsilon + global_epsilon) -
            differentiable_function(arg, epsilon)) / global_epsilon


def calculate_flip_points():
    flip_points = np.array([0, 0])
    points = np.zeros((360, arr_shape), dtype=bool)
    cx, cy = centre

    for i in range(arr_shape):
        for alpha in range(360):
            x, y = rotate_vector(step, alpha)
            x = x * i + cx
            y = y * i + cy
            points[alpha][i] = derivative_x(x, y) + derivative_y(y, x) > 0
            if not points[alpha][i - 1] and points[alpha][i]:
                flip_points = np.vstack((flip_points, np.array([alpha, i - 1])))

    return flip_points


def pick_estimates(positions):
    vx, vy = rotate_vector(step, positions[1][0])
    cx, cy = centre
    best_x, best_y = cx + vx * positions[1][1], cy + vy * positions[1][1]

    for index in range(2, len(positions)):
        vx, vy = rotate_vector(step, positions[index][0])
        x, y = cx + vx * positions[index][1], cy + vy * positions[index][1]
        if differentiable_function(best_x, best_y) > differentiable_function(x, y):
            best_x = x
            best_y = y

    for index in range(360):
        vx, vy = rotate_vector(step, index)
        x, y = cx + vx * (arr_shape - 1), cy + vy * (arr_shape - 1)
        if differentiable_function(best_x, best_y) > differentiable_function(x, y):
            best_x = x
            best_y = y

    return best_x, best_y


def gradient_descent(best_estimates, is_x):
    derivative = derivative_x if is_x else derivative_y
    best_x, best_y = best_estimates
    descent_step = step
    value = derivative(best_y, best_x)

    while abs(value) > global_epsilon:
        descent_step *= 0.95
        best_y = best_y - descent_step \
            if derivative(best_y, best_x) > 0 else best_y + descent_step
        value = derivative(best_y, best_x)

    return best_y, best_x


def find_minimum():
    return gradient_descent(gradient_descent(pick_estimates(calculate_flip_points()), False), True)


def get_grid(grid_step):
    samples = np.arange(-radius, radius, grid_step)
    x, y = np.meshgrid(samples, samples)
    return x, y, differentiable_function(x, y)


def draw_chart(point, grid):
    point_x, point_y, point_z = point
    grid_x, grid_y, grid_z = grid
    plot.rcParams.update({
        'figure.figsize': (4, 4),
        'figure.dpi': 200,
        'xtick.labelsize': 4,
        'ytick.labelsize': 4
    })
    ax = plot.figure().add_subplot(111, projection='3d')
    ax.scatter(point_x, point_y, point_z, color='red')
    ax.plot_surface(grid_x, grid_y, grid_z, rstride=5, cstride=5, alpha=0.7)
    plot.show()


if __name__ == '__main__':
    min_x, min_y = find_minimum()
    minimum = (min_x, min_y, differentiable_function(min_x, min_y))
    draw_chart(minimum, get_grid(0.05))

