There are a lot of tips and tricks that allow iOS developers to know how to make performance optimizations to get animations in applications run smoothly. After reading the article you will realize what 16.67 milliseconds for iOS developer means, and which tools are better to use to track down the code.
The article is based on the keynote talk delivered by Luke Parham, currently an iOS engineer at Apple and an author of tutorials for iOS development on RayWenderlich.com, at the International Mobile Developers Conference MBLT DEV 2017.
“Hey, guys. If you can, let’s say, you can shave 10 seconds off of the boot time, multiply that by 5 million users and that’s 50 million seconds every single day. Over a year, that’s probably dozens of lifetimes. So if you make it boot ten seconds faster, you’ve saved a dozen lives. That’s really worth it, don’t you think?”
Steve Jobs about the performance (boot time of Apple II).
Performance in iOS or how to get off main
The main thread is responsible for accepting user input and displaying results to the screen. Accepting taps, pans, all gestures and then rendering. Most of the modern mobile phones render at 60 frames per second. It means that everybody wants to do all of the work within 16.67 milliseconds. So, getting off of main thread is a really big thing.
If anything takes longer than 16.67 milliseconds, then you will automatically be dropping frames, and your users will see it when there are animations going. Some devices have even less time to render, for example, new iPad has 120 Hertz, so there are only 8 milliseconds per frame to do the work.
Dropped frames
Rule #1: use a CADisplayLink to track dropped frames
CADisplayLink is a special timer that fires on the Vsync. The Vsync is when the app is rendering to the screen, and it happens every 16 milliseconds. For testing purposes, in your AppDelegate, you can set up CADisplayLink added to the main run loop and then just have other function where you do a little bit of math. Then you track how long the app has been running and how long it has been since the last time this function was fired. And see if it took longer than 16 milliseconds.
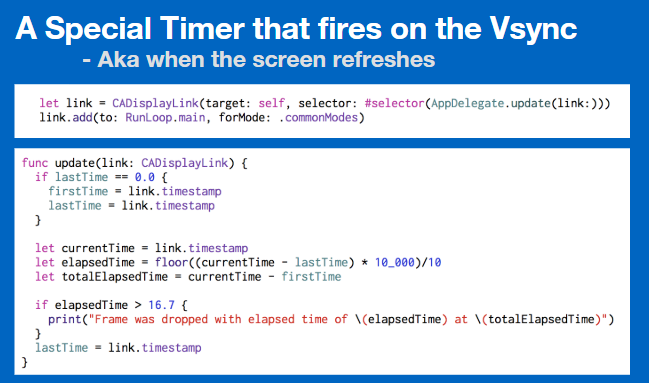
This only fires when it actually gets to render. If you were doing a bunch of work and you slowed down the main thread, this will run 100 milliseconds later, which means you have done too much work and you have dropped frames in that time.
For example, this is the app Catstagram. It has stutters when the picture is loading. And then you can see that frame was dropped at a certain time and it had an elapsed time of like 200 milliseconds. That means this app is doing something that is taking too long.
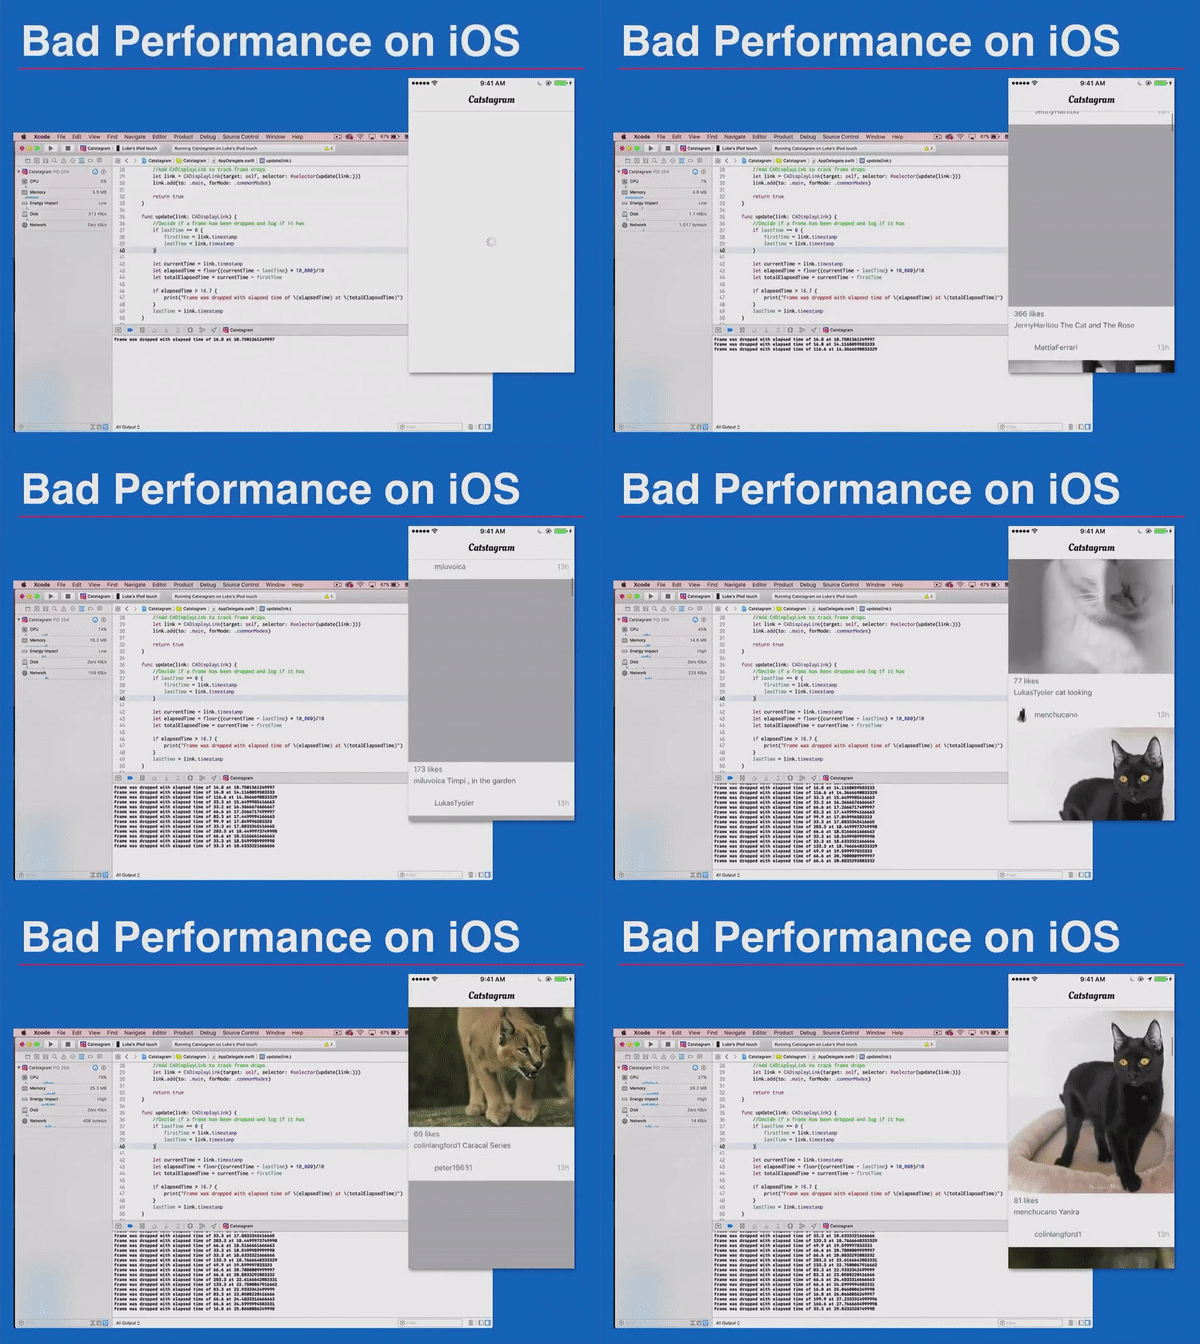
Users do not like such an experience especially if the app supports older devices like iPhone 5, old iPods, etc.
Time Profiler
Time Profiler is probably the most useful tool for tracking down the stuff. The other tools are useful but, in the end, in Fyusion we use Time Profiler like 90% of the time. The usual suspects of the application are scrollview, text, and images.
Images are the really big one. We have JPEG decoding — “UIImageView” equals some UIImage. UIimages decode all the JPEGs for the app. They do it slowly so you can not really track the performance directly. It does not happen right when you set the image but you can see it in time profiler traces.
Text measurement is another big thing. It does show up, e.g. if you have a lot of really complex one like Japanese or Chinese. These can take a long time to do the measurement for lines.
The hierarchy layout also slows the app rendering. This is especially true with Auto Layout. It is convenient but it is also aggressively slow compared to doing the manual layout. So it is one of those trade-offs. If it slows down the app, it may be time to switch away from it and try some other layout technique.
Example Trace
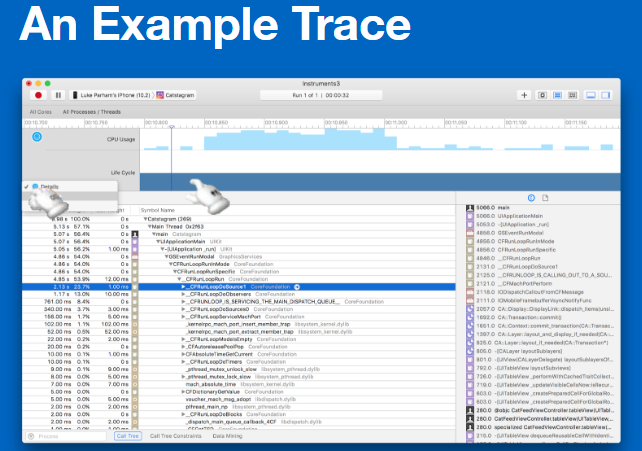
At the example call tree, you can see how much work your CPUs are doing. You can switch the views, look at it by threads, look at it by CPUs. Usually, the most interesting thing is to separate by threads and then look what is on main.
A lot of times when you first start looking at this, it seems super overwhelming. You sometimes have a feeling: “What is all this garbage? I don’t know what this means “СFRunLoopDoSource0”.
But it is one of things where you could dig into and understand how things work and it starts to make sense. So you can follow the stack trace and look at all the system things that you did not write. But down at the bottom, you can see your actual code.
The Call Tree
For example, we have a really simple app that has the main function, and then it calls a few methods inside the main one. What time profiler does is that it takes a snapshot of whatever your stack trace is right now by default every millisecond. Then it waits one millisecond and takes a snapshot, where you have called “main” which called “foo” which called “bar”. There is the first stack trace over the screenshot. So that gets collected. We have these counts: 1, 1, 1.
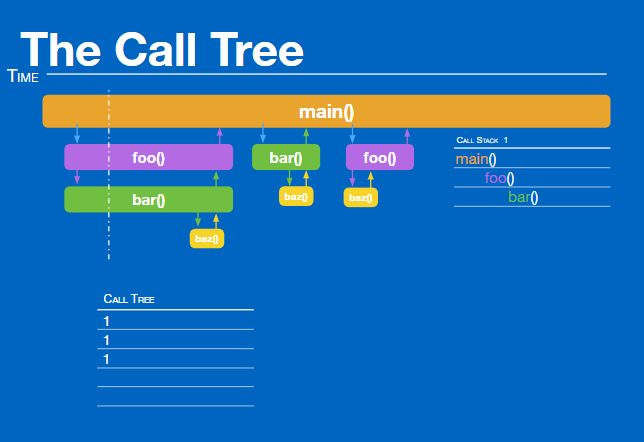
Each of these functions has been called one time. Then a millisecond later we capture another stack. And this time, it is exactly the same thing, we up all the counts by 2.

Then on the third millisecond, we have a slightly different call stack. Main is calling “bar” directly. Main and bar are up by one. But then we have a split. Sometimes main calls “foo”, sometimes main calls “bar” directly. That happens one time. One method has been called inside another.
Further on, one method has been called inside another which calls the third method. We see that “buz” was called twice. But it is such a small method that it happens between the one millisecond.
Using time profiler, it is important to remember that it does not give the exact times. It does not tell exactly how long a method takes. It tells how often it appears in snapshots, which can only approximate how long execution of each method took. Because if something is short enough, it will never show up.

If you switch to the console mode in the call tree, you can see all of the frame drop events and you can match them up. We have a bunch of frames being dropped and we have a bunch of work happening. You can zoom in time profiler and see what was being executed just in this section.

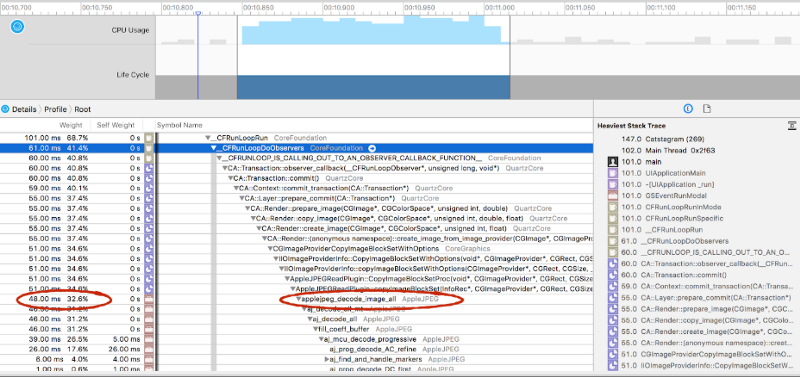
Actually, in Mac, in general, you can option-click on disclosure triangles and it will magically open and show you whatever is the most important thing in there. It will drop down to whatever is doing most work. And 90% of the time it will be CFRunLoopRun, and then the callbacks.

The whole app is based on a Run Loop. You have this loop that is going forever and then at every iteration of the loop the callbacks are called. When you get to this point, you can drill down into each of these and basically look at what your top three or four bottlenecks are.
If we drill into one of these, we can see such things where it is really easy to look at it, and be like: “Wow, I don’t know what this is doing.” Like renders, image provider, IO.

There is an option where you can hide system libraries. It is really tempting to hide, but in reality, this is actually the biggest bottleneck in the app.
There are the weights that show what percentage of the work this particular function or method is doing. And if we drill down the example, we have 34% and it happens because of Apple jpeg_decode_image_all. After a little research, it becomes clear that it means that JPEG decoding is happening on the main thread and causes the majority of the frame drops.
Rule #2
Generally, it is better to decode JPEGs in the background. Most of the third-party libraries (AsyncDisplayKit, SDWebImage, …) do this out of the box. If you do not want to use frameworks, you can do it yourself. What you do is you pass in an image, in this case, it is an extension of UIImage, and then you set up a context and you draw the image manually into a context into a CGBitmap.

When you do that you can call decoded Image() method from a background thread. That will always return the decoded image. There is no way to check if in particular UIImage is already decoded, and you always have to pass them through here. But if you cache things correctly, it does not do any extra work.
Doing this is technically less efficient. Using UIimageView is super optimized, super efficient. It will do hardware decoding so it is a trade-off. Your images will be decoded more slowly this way. But the good thing is that you can dispatch to a background queue, decode your image with that method we just saw, and then jump back onto the main thread and set your contents.

Even though that work took longer, maybe it did not happen on the main thread, so it was not blocking user interaction since it did not block scrolling. So that is a win.
Memory warnings
Any sign you get a memory warning you want to drop everything, delete all the unused memory you can. But if you have things that are happening on background threads, allocating these big decoded JPEGs takes up a lot of new memory on background threads.
This happened in the Fyuse app. If I would jump to a background thread, decode all my JPEGs, in some cases on like older phones, the system would kill it instantly. And that is because it is sending out a memory warning saying like: “Hey! Get rid of your memory” but the background queues do not listen. What happens if you are allocating all these images and then it crashes every time. The getting around this is to ping the main thread from the background thread.
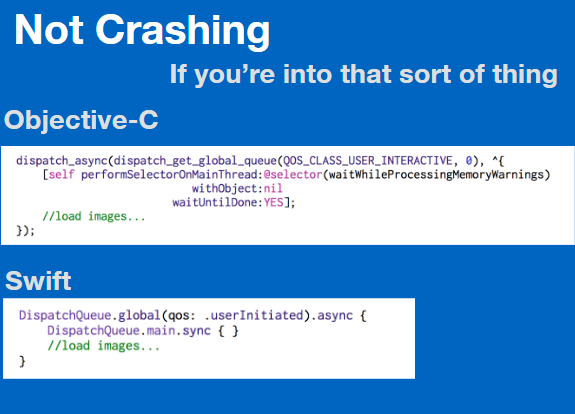
In general, the main thread is a queue. Things get queued up and happen on the main thread. When you go to the background in Objective-C, you can use performSelectorOnMainThread:withObject:waitUntilDone:. This will put it at the end of the main queues line so if the main queue is busy processing memory warnings, this function call will go to the end of the line and wait all the memory warnings are processed before it does all this heavy allocation of memory.
In Swift, it is simpler. You can do a dispatch main empty block synchronously on main.
Here is an example where we have cleaned things up and we are doing image decoding on background queues. And the scrolling visually is a lot prettier. We are still having frame drops but this is on an iPod 5g, so it is one of the worst things you can test on that still supports like iOS 10 and 11.
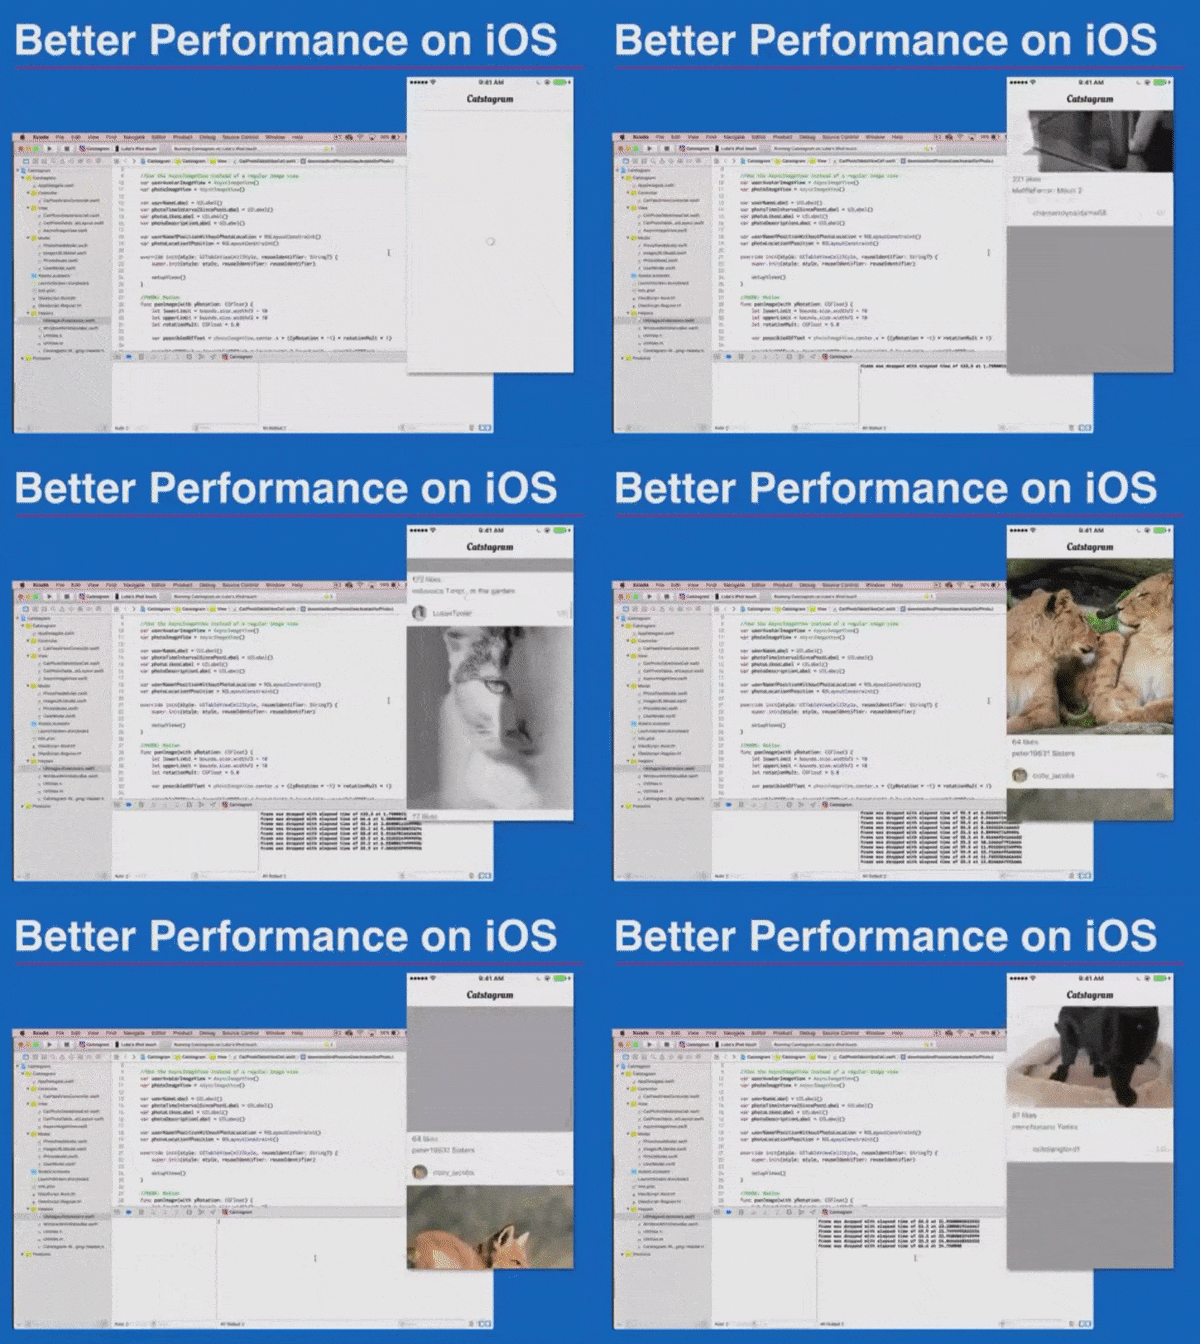
When you have these frame drops, you could keep looking. There is still work that is happening and causing these frame drops. There are more things you could do to make it faster.
To sum up, it is not always that easy, but if you have little things that are taking a lot of time, you can do them in the background.
Make sure it is not UIKit related. A lot of UIKit classes are not thread-safe and you cannot allocate that UIView in the background.
Use Core Graphics if you need to do image things in the background. Do not hide system libraries. And do not forget about memory warnings.
This is the first part of an article based on Luke Parham’s presentation. If you would like to learn more about the way UI works in iOS, why to use a bezier path and when to fall back to manual memory management, read the second part of an article here.
Video
Watch the full talk here: