PVS-Studio is a tool for detecting software bugs and potential vulnerabilities in the source code of software written in C, C++, C#, and Java. The analyzer runs on Windows, Linux, and macOS.

To be able to work with Visual C#, the analyzer integrates into Visual Studio as a plugin. This allows you to use Visual Studio's interface to customize the analyzer's settings, quickly and easily check individual files, projects, and solutions, and to handle PVS-Studio reports as well.
The hardware requirements for this mode are the same as those of the Visual Studio IDE that you work in.
The PVS-Studio installer can be downloaded here. The download page also offers a number of different use modes, including trial mode. See the purchase guide for licensing details.
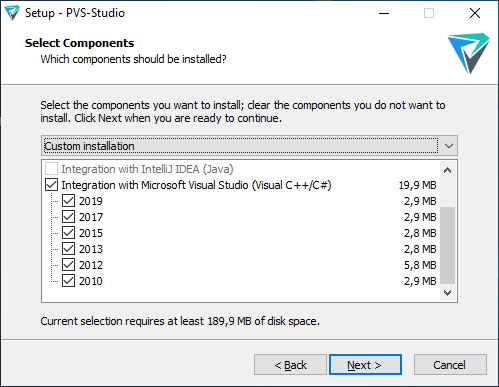
To install the plugin, run the PVS-Studio installer and tick the desired Visual Studio versions:
The analyzer is ready to run immediately after installation.
Run Visual Studio, open your project, click the «Extensions» main menu and then the «PVS-Studio» submenu (in Visual Studio versions earlier than 2019, the «PVS-Studio» menu is placed right on the menu bar).
A drop-down menu will appear with all the plugin's features available for use.
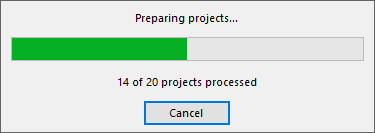
To check the entire solution, click the «Check» submenu and then «Solution». The analyzer will start preparing for the check:
After that, the analysis process starts:

Even before the check is over, warnings will start to appear in the report (PVS-Studio window) as the analyzer runs on, so you can start examining the respective code fragments right away. Double-clicking on a warning will take you to the corresponding code snippet in the Visual Studio editor, with suspicious lines highlighted:

Clicking a diagnostic number link (for example, V3095) in the PVS-Studio window will take you to the documentation on that diagnostic, where you can learn the details about it and ways to fix bugs it detects.
You can save analysis results to study them later. To do that, open the «Extensions» menu, then «PVS-Studio» -> «Open/Save» -> «Save Analysis Report» (in Visual Studio versions earlier than 2019, the «PVS-Studio» menu is placed right on the menu bar).
We keep working to make our C# analyzer better. As one of the latest innovations, we added support of Nullable Reference types for the C# 8.0 standard.
To learn more about the features of the PVS-Studio Windows plugin, see the article "Getting acquainted with the PVS-Studio static code analyzer on Windows".
You can also use command-line utilities to check Visual C# projects and solutions. This use mode is extensively covered in the article "Analyzing Visual Studio projects from the command line".
Finally, the article "PVS-Studio and Continuous Integration" explains how PVS-Studio can be used in expert inspection.
Try PVS-Studio — get rid of bugs!

To be able to work with Visual C#, the analyzer integrates into Visual Studio as a plugin. This allows you to use Visual Studio's interface to customize the analyzer's settings, quickly and easily check individual files, projects, and solutions, and to handle PVS-Studio reports as well.
The hardware requirements for this mode are the same as those of the Visual Studio IDE that you work in.
The PVS-Studio installer can be downloaded here. The download page also offers a number of different use modes, including trial mode. See the purchase guide for licensing details.
To install the plugin, run the PVS-Studio installer and tick the desired Visual Studio versions:

The analyzer is ready to run immediately after installation.
Run Visual Studio, open your project, click the «Extensions» main menu and then the «PVS-Studio» submenu (in Visual Studio versions earlier than 2019, the «PVS-Studio» menu is placed right on the menu bar).
A drop-down menu will appear with all the plugin's features available for use.
To check the entire solution, click the «Check» submenu and then «Solution». The analyzer will start preparing for the check:

After that, the analysis process starts:

Even before the check is over, warnings will start to appear in the report (PVS-Studio window) as the analyzer runs on, so you can start examining the respective code fragments right away. Double-clicking on a warning will take you to the corresponding code snippet in the Visual Studio editor, with suspicious lines highlighted:

Clicking a diagnostic number link (for example, V3095) in the PVS-Studio window will take you to the documentation on that diagnostic, where you can learn the details about it and ways to fix bugs it detects.
You can save analysis results to study them later. To do that, open the «Extensions» menu, then «PVS-Studio» -> «Open/Save» -> «Save Analysis Report» (in Visual Studio versions earlier than 2019, the «PVS-Studio» menu is placed right on the menu bar).
We keep working to make our C# analyzer better. As one of the latest innovations, we added support of Nullable Reference types for the C# 8.0 standard.
To learn more about the features of the PVS-Studio Windows plugin, see the article "Getting acquainted with the PVS-Studio static code analyzer on Windows".
You can also use command-line utilities to check Visual C# projects and solutions. This use mode is extensively covered in the article "Analyzing Visual Studio projects from the command line".
Finally, the article "PVS-Studio and Continuous Integration" explains how PVS-Studio can be used in expert inspection.
Try PVS-Studio — get rid of bugs!