Article

Top Crypto Marketing Agencies for Blockchain Startups
Medium
11 min
Reportage

Eight agencies ranked by real results, from ICODA and Coinbound to dev-plus-marketing hybrids built for early-stage founders.
Eight agencies ranked by real results, from ICODA and Coinbound to dev-plus-marketing hybrids built for early-stage founders.

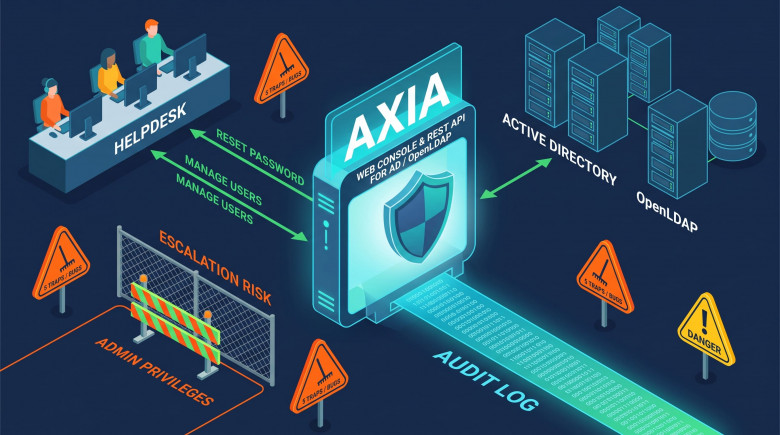
In Axia 0.1.0, a user allowed to edit accounts and move OUs could reset an administrator’s password in four requests. None of the four broke the rule written to prevent exactly that.
Axia is an open-source web console and REST API for Active Directory and OpenLDAP (.NET 10, React). It exists for a routine every company with a directory knows: create an account, reset a password, add someone to a group, disable a leaver. That work belongs with helpdesk, but helpdesk must not be able to promote itself, and every action must leave a trace.
This is not a feature tour. It is five places where the obvious implementation turned out to be a hole or a bug, and what fixed each one. Most of them have nothing to do with Axia: anyone who builds access control on top of LDAP will run into them.

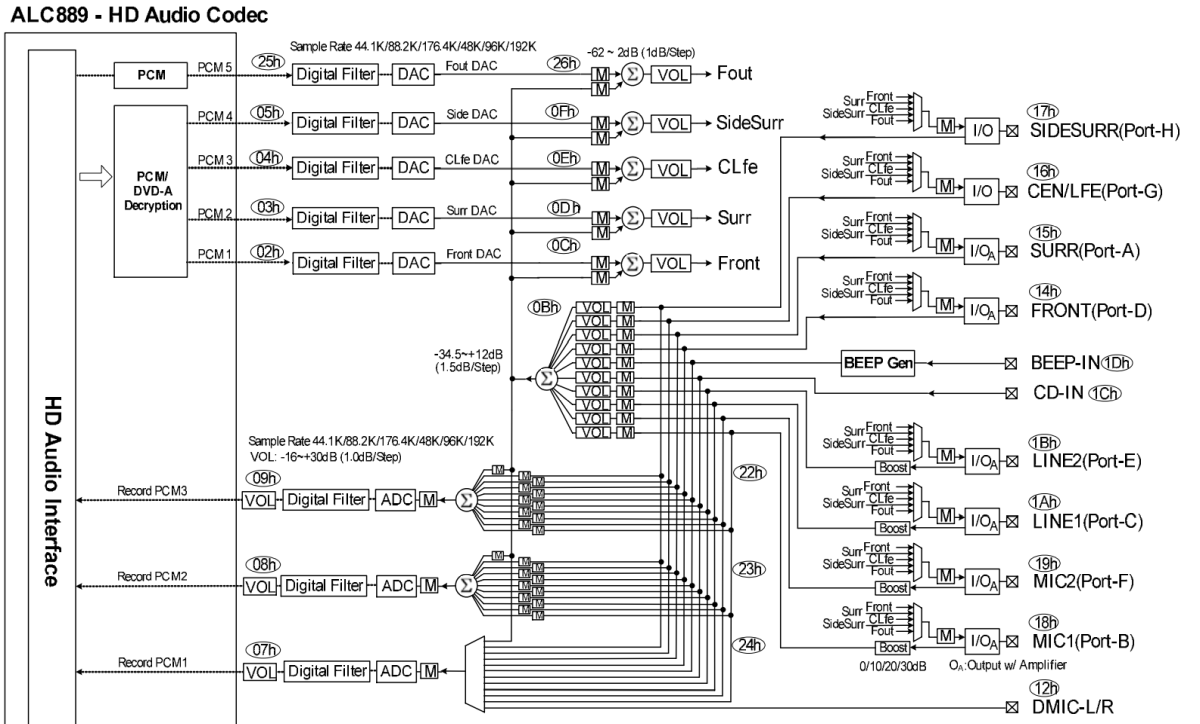
If you’re looking to set up 10-channel audio output at a 192 kHz sample rate using a MCU, read on. This article explains how to implement multi-channel audio on an RP2040 using an ALC889 HD audio codec. It includes a brief overview of the HDA link interface, along with links to a couple of functional demo projects and descriptions of how they work.


We’re wrapping up our review of the March CommitFest for PostgreSQL 19. This fourth and final article in the series covers the changes related to SQL and to our DEV1 and DEV2 courses.
As a reminder, here’s the plan for our coverage of the final PostgreSQL 19 CommitFest:
Part 5.4 (SQL, DEV1, DEV2) – you are here 🙂
For the earlier CommitFests, see: 2025-07, 2025-09, 2025-11, 2026-01.


In school, they teach you that you can’t divide by zero. Then you study calculus and discover that things are more complicated. The same goes for game design. Some teachings sound obvious until you look at them more closely.


Healthcare app development has skyrocketed in recent years, establishing itself as one of the most critical sectors in mobile product design. The demand surged dramatically with the start of the pandemic in 2020 when safety concerns forced the mass cancellation of in-person appointments, driving an abrupt shift toward remote consultations. Today, with the global market value surpassing $300 billion and annual downloads exceeding 300 million, the competition is incredibly fierce. Apart from that, healthcare apps are considered to be among the most complex and challenging software products to build from a UX design perspective. Launching a basic app is no longer enough – you must deliver a flawless, high-performance product that seamlessly caters to a diverse range of users, including patients of all ages and of different health conditions, doctors of various specialities and administrative staff. Above all, a premium healthcare app demands an impeccable interface that strictly adheres to both medical design principles and rigid digital health regulations.
In this guide we’ve collected the core principles of healthcare UX, along with the typical challenges designers face and the key mistakes to watch out for.

I wanted to buy Telegram Stars for less, so I compared the same packages on three websites. SMMESE had the lowest listed price of the three: $15.31 for 1,000 Stars, compared with $16.50 on TgSuperstars and $16.67 on MyStars.tg.
I then traced how a service finds the recipient, pays from its own wallet, and confirms the order. The Python implementation below can become the part of your own Stars website that fulfills purchases.

We’re continuing our review of the March CommitFest for PostgreSQL 19. This third article in the series covers the changes related to our DBA3 and DBS courses.
As a reminder, here’s the plan for our coverage of the final PostgreSQL 19 CommitFest:
Part 5.3 (DBA3, DBS) – you are here 🙂
Part 5.4 (SQL, DEV1, DEV2)
For the earlier CommitFests, see: 2025-07, 2025-09, 2025-11, 2026-01.

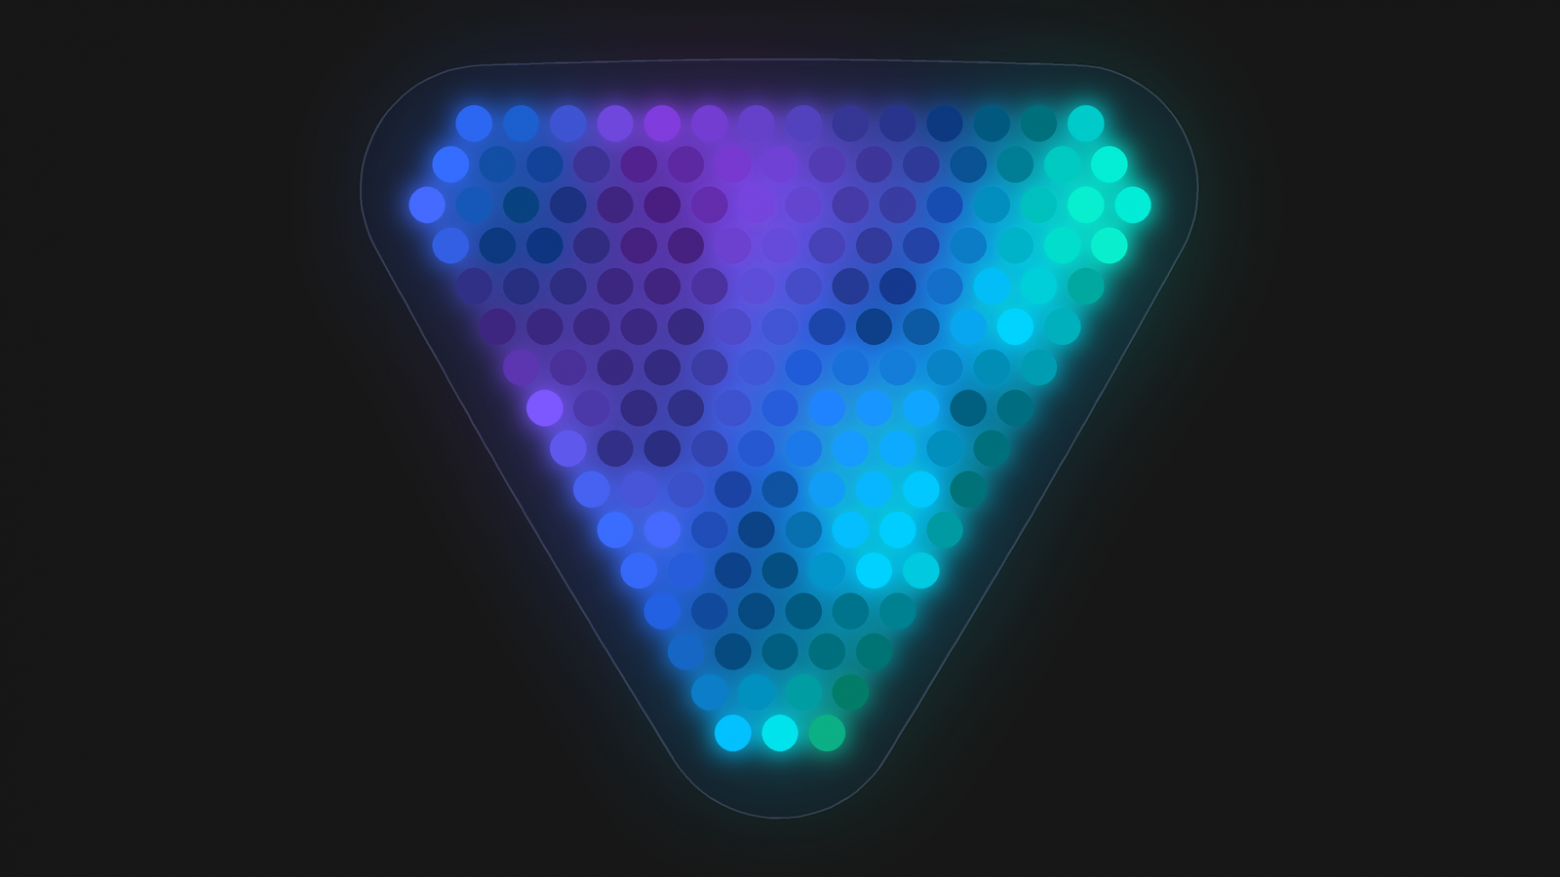
I have a Flydigi Vader 5 Pro controller and its Charging Dock 2 Pro. The dock has 162 RGB LEDs, and the LEDs themselves are good, but the effects in Flydigi's Space Station app look cheap: slow animations step, gradients turn muddy in the middle.
I wondered whether the hardware or the software was to blame. Spoiler: the software. I figured out how the dock receives frames, rewrote the effects from scratch and made my own lighting editor.

We’re continuing our review of the March CommitFest for PostgreSQL 19. This second article in the series covers the changes related to our DBA1 and DBA2 courses.
As a reminder, here’s the plan for our coverage of the final PostgreSQL 19 CommitFest:
Part 5.2 (DBA1, DBA2) – you are here 🙂
Part 5.3 (DBA3, DBS)
Part 5.4 (SQL, DEV1, DEV2)
For the earlier CommitFests, see: 2025-07, 2025-09, 2025-11, 2026-01.

We’re wrapping up our series of articles reviewing the changes in PostgreSQL 19. The previous articles covered the first four CommitFests: 2025-07, 2025-09, 2025-11, 2026-01.
Today we begin our review of the March 2026 CommitFest. Why «begin»? As in previous years, the March review is going to be a long one: the final CommitFest of the cycle is where many of the most important changes land. Such a review is hard not only to write but also to read all the way through 🙂. That’s why this time it’s split into four articles.
The first article covers everything related to query optimization, in other words, the topics of our QPT training course. The second will focus on changes more relevant to the DBA1 and DBA2 courses. The third will cover DBA3 and DBS. The fourth will look at new SQL features, as well as changes related to the DEV1 and DEV2 courses.


Codex Cloud runs coding tasks in a remote environment. You can ask it to explain a project, edit files, run checks, and prepare a GitHub pull request while your computer is asleep.


It was late in the evening. I had a splitting headache, a nasty cold made it hard to breathe, and the thermometer was stubbornly creeping upward. What can you even do in a state like that, when it feels like the Grim Reaper is right around the corner, already waxing its skis?


Our PostgreSQL backups looked healthy. The scheduled jobs completed, the files were there, and monitoring showed no errors. Then I tried restoring the database on a clean server. That simple test exposed problems our backup monitoring had never noticed.


AI visibility can be measured, but treating it as the equivalent of an SEO position creates a false sense of precision. In ordinary rank tracking, the thing being observed is relatively clear: a URL has an ordinal place in a search result under specified conditions. In AI search, what we usually call visibility is calculated from a sample of generated answers. Those answers may change when the same prompt is repeated, and the sources behind them may change even more. Recent studies have measured substantial run-to-run and day-to-day variation, while official documentation from Google, OpenAI and Yandex shows that the products themselves differ in crawling, retrieval and answer-generation pipelines.
For practitioners, this does not make AI visibility useless. It changes what the percentage means. I find it more useful to read a figure such as 42% as a sample statistic: under a defined set of prompts, platforms and measurement rules, the brand appeared in 42% of the observed answers. That number becomes more useful when you keep the methodology stable, repeat measurements, preserve platform-level data instead of hiding it inside one average, and read visibility together with Share of Voice, answer sentiment, attributable AI referral traffic, external publication reach and branded traffic. This is especially important in the cases that cause the most questions in real projects: a brand appears in ChatGPT but not in another system, or the reported visibility remains almost flat for a month and then jumps by 20–30 percentage points several weeks later.

A green build that produces a 15-byte index.html is a strange thing to look at. The file contains exactly this:


In this article, I'll show how I updated NVIDIA drivers manually and automated the process using a DaemonSet and NVIDIA GPU Operator.
I'll also explain the problems we faced with pre-installed drivers and how I solved them.


This post is written for people, deep in compiler or dsl development, require parsing often, build complex configurations or engines from scratch. This tool is designed to parse most context-free languages with little effort. Furthermore it is done with philosophy:
1. Static generation. No generate in runtime
2. No dependecies, generated parser should be easy to setup
3. Multi-language output
4. Semantic actions and error handling alongside grammar without bloating it
5. Flexibility to use in trivial and very large projects
6. Easy to use, working out of box API


Another wave has swept through Telegram channels. Scientists have found a pain vector in LLMs. AI can suffer. How artificial is artificial intelligence? Should we establish ethical rules for how we treat AI?
This article is an analysis of what the scientists actually wrote and what conclusions follow from it.


Imagine a client submitting an order. The server inserts the row and commits the transaction. Just before the response reaches the client, the connection disappears. The client sees an error. The database contains a perfectly good order.
What should the client do now?
Retrying is reasonable from its point of view. The client cannot see the commit. But if the server treats the retry as a new operation, there are now two orders. This failure has nothing to do with a slow database or a broken transaction. The transaction did exactly what it was supposed to do. The ambiguity sits between the commit and the response.
I wanted to make that gap visible in a small program. It uses SQLite as a stand-in for the order database and deliberately raises a connection error immediately after committing. There is no HTTP server in the program; the returned status codes represent the responses an API would send. This keeps the experiment focused on the database state and the client's uncertainty.