
Greetings to all!
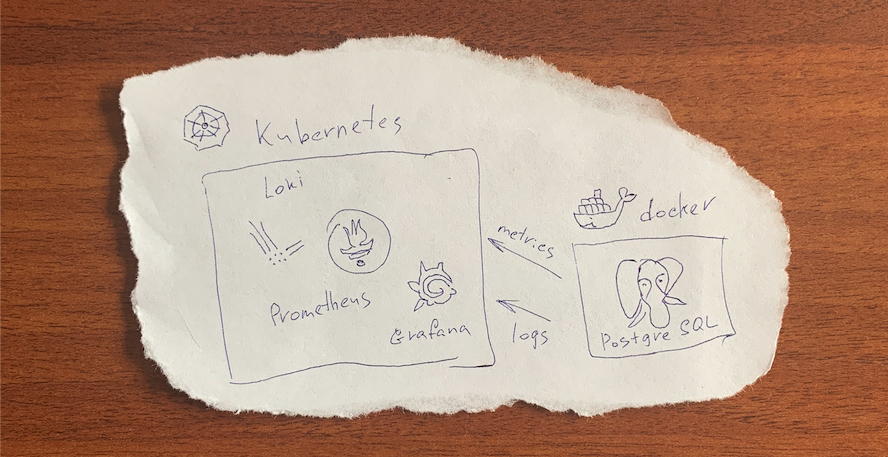
As a matter of fact I haven't found so far any generalized guide on logging and monitoring of metrics from external systems to Kubernetes on the web. Here I want to share with you my own version. First of all it is supposed that you have already got working Prometheus and other services.
As an example I use third-party data for stateful service RDBMS PostgreSQL in a Docker container. In our company we also use the Helm package manager, and you'll find how it works below. You can see same examples in this article below. You can see same examples in this article below. For a complete solution we create a nested chart.
Logging
Many companies use ELK stack for centralized logging (Elasticsearch + Logstash + kibana). In our case we don't need to index the content and I apply lightweight Loki. It is available and can be installed as a Helm package. We added it as subchart having changed values for ingress & pv.
values.yaml
ingress:
  enabled: true
  annotations:
     kubernetes.io/ingress.class: nginx
  hosts:
    - host: kube-loki.example.domain
      paths:
        - /
  tls: []

....

persistence:
  type: pvc
  enabled: true
  accessModes:
    - ReadWriteOnce
  size: 100Gi
  finalizers:
    - kubernetes.io/pvc-protection
  existingClaim: "pv-loki"
We use Loki Docker Logging Driver for log sending to instance Loki.
You have to set it up as a Docker plugin on all hosts from which you want to get logs. There are several ways to use plugin. My choice is to put it in the yaml file of Docker Compose which is a part of Ansible playbook.
postgres.yaml
where is loki_url: kube-loki.example.domain/loki/api/v1/push
    - name: Run containers
      docker_compose:
        project_name: main-postgres
        definition:
          version: '3.7'
          services:
            p:
              image: "{{ postgres_version }}"
              container_name: postgresql
              restart: always
              volumes:
                - "{{ postgres_dir }}/data:/var/lib/postgresql/data"
                - "{{ postgres_dir }}/postgres_init_scripts:/docker-entrypoint-initdb.d"
              environment:
                POSTGRES_PASSWORD: {{ postgres_pass }}
                POSTGRES_USER: {{ postgres_user }}
              ports:
                - "{{ postgres_ip }}:{{ postgres_port }}:5432"
              logging:
                driver: "loki"
                options:
                  loki-url: "{{ loki_url }}"
                  loki-batch-size: "{{ loki_batch_size }}"
                  loki-retries: "{{ loki_retries }}"
...
where is loki_url: kube-loki.example.domain/loki/api/v1/push
Metrics
PostgreSQL metrics are collected to Prometheus with a postgres_exporter. See extension of Ansible playbook file below.
postgres.yaml
...
            pexp:
              image: "wrouesnel/postgres_exporter"
              container_name: pexporter
              restart: unless-stopped
              environment:
                DATA_SOURCE_NAME: "postgresql://{{ postgres_user }}:{{ postgres_pass }}@p:5432/postgres?sslmode=disable"
              ports:
                - "{{ postgres_ip }}:{{ postgres_exporter_port }}:9187"
              logging:
                driver: "json-file"
                options:
                  max-size: "5m"
...
For better clarity the names of external stateful services are presented with Endpoints.
postgres-service.yaml
apiVersion: v1
kind: Endpoints
metadata:
  name: postgres-exporter
subsets:
  - addresses:
      - ip: {{ .Values.service.postgres.ip }}
    ports:
      - port: {{ .Values.service.postgres.port }}
        protocol: TCP
---
apiVersion: v1
kind: Service
metadata:
  name: postgres-exporter
  labels:
    chart:  "{{ .Chart.Name }}-{{ .Chart.Version | replace "+" "_" }}"
spec:
  ports:
    - protocol: TCP
      port: {{ .Values.service.postgres.port }}
      targetPort: {{ .Values.service.postgres.port }}
Prometheus settings for getting data from postgres_exporter are tuned by means of value editing in the subchart.
values.yaml
scrape_configs:
...
  - job_name: postgres-exporter
    static_configs:
      - targets:
         - postgres-exporter.applicationnamespace.svc.cluster.local:9187
        labels:
          alias: postgres
...
For visualisation of data install a proper dashboard for Grafana and add datasource. That can be done with values of Grafana subchart. See how it looks below.
How it looks

I hope my first brief article in English will help you to understand basic ideas of this solution and save your time when adjusting monitoring and logging procedures of external services in Loki/Prometheus in Kubernetes.
