One of the key trends in software infrastructure in 2019 is Observability.
It has gained a lot of attention recently.

There are a lot of discussions and jokes about this term. For example:
Cindy Sridharan
What is the difference between monitoring and Observability if there is one?
Years ago, we mostly ran our software on physical servers. Our applications were monoliths that were built upon LAMP or other stacks. Checking uptime was as simple as sending regular pings and checking the CPU/disk usage for your application.

The main paradigm shift came from the fields of infrastructure and architecture. Cloud architectures, microservices, Kubernetes, and immutable infrastructure changed the way companies build and operate systems.
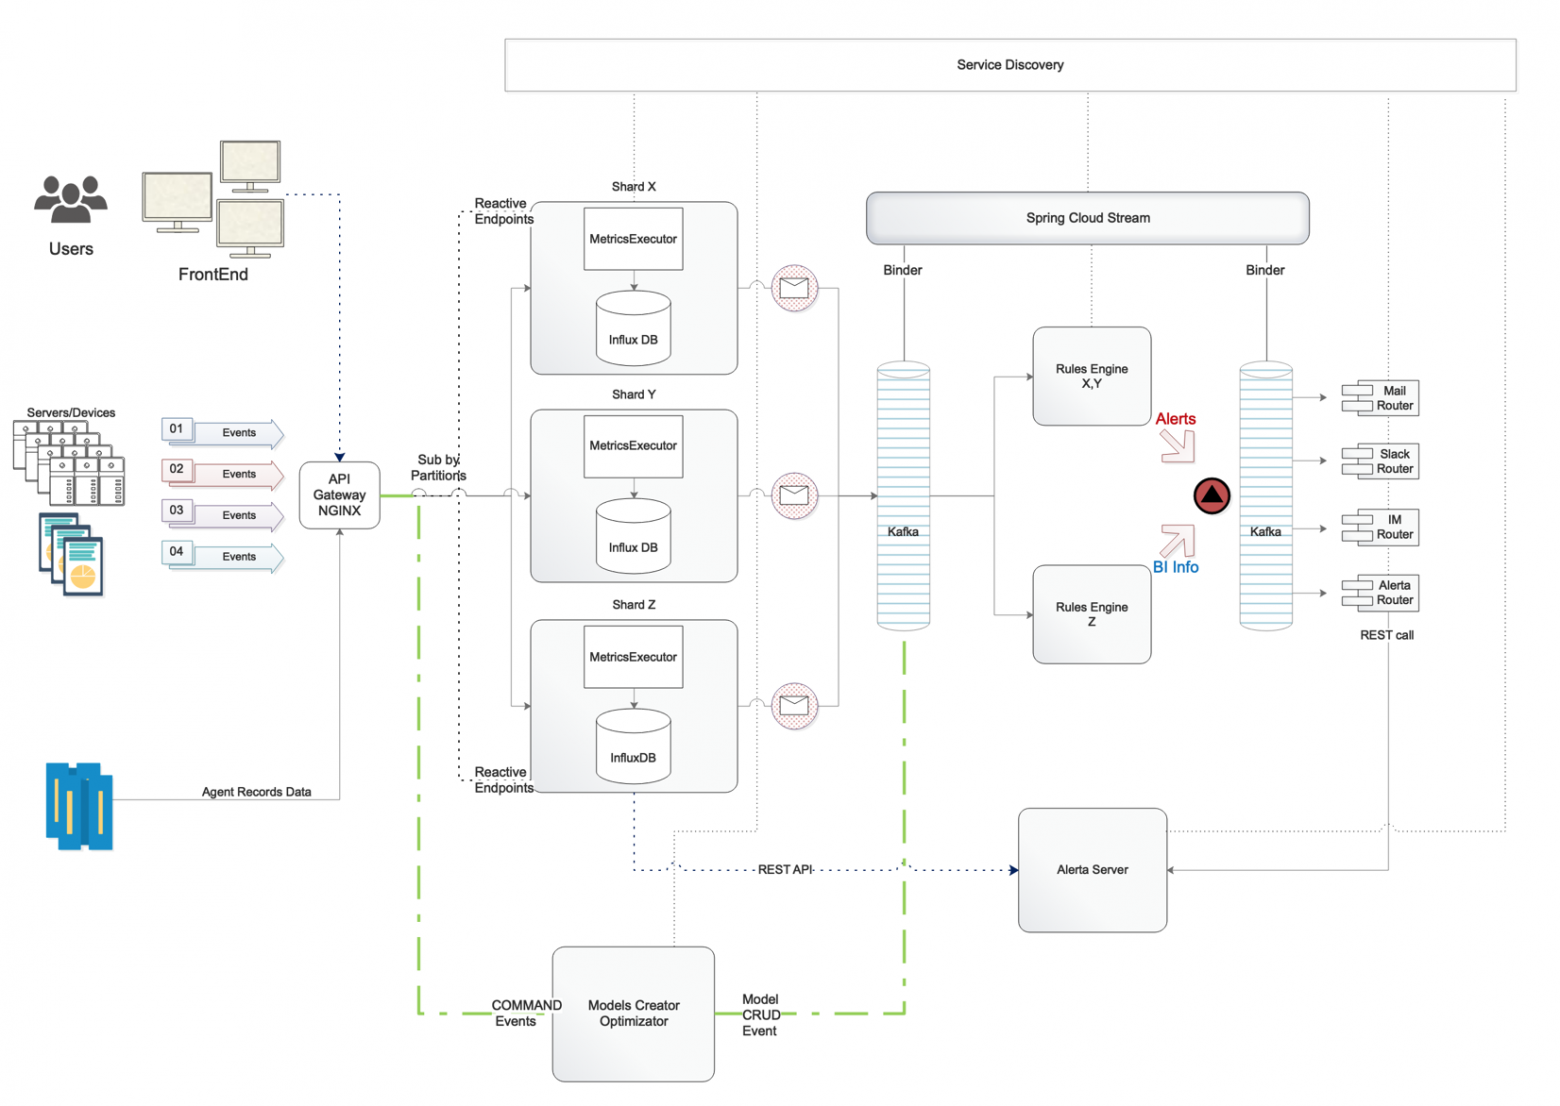
As a result of the adoption of these new ideas, the systems we have built have become more and more distributed and ephemeral.
Virtualization, containerization, and orchestration frameworks are responsible for providing computational resources and handling failures creates an abstraction layer for hardware and networking.
Moving towards abstraction from the underlying hardware and networking means that we must focus on ensuring that our applications work as intended in the context of our business processes.
Monitoring is to operations essentially what testing is to software development. In fact, tests check the behaviour of system components against a set of inputs in a sandboxed environment, usually with a large number of mocked components.

The main issue is that the amount of possible problems in production cannot be covered with tests in any way. Most of the problems in a mature, stable system are unknown-unknowns that are related not only to software development itself, but also to the real world.
There are two approaches to monitoring.
In the case of black box monitoring, we treat the system or parts of it as a black box and test them outside. This could mean checking API calls, load time, or the availability of different parts of the system. In this case, the amount of information about and control over the system is limited.

White box monitoring refers to the situation, where we derive information from the system’s internals. This is not a revolutionary idea, but it has gained a lot of attention recently.
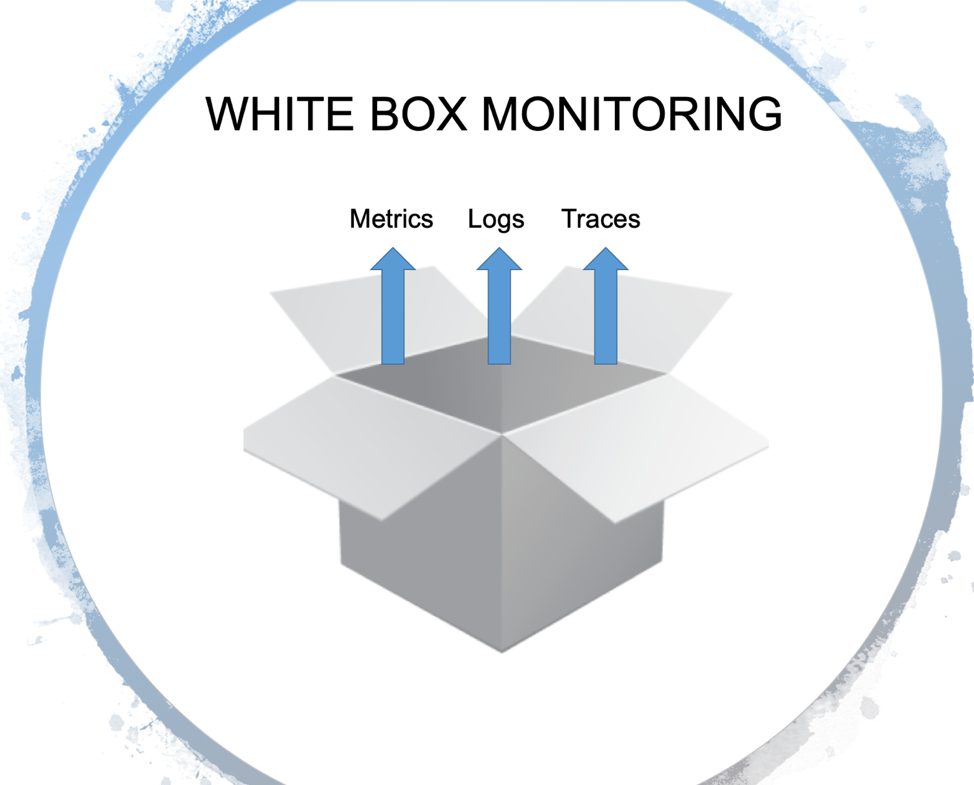
So, Observability is just another name for white box monitoring? Not quite.
Often, a distinction is made between monitoring and the concept of Observability, with the latter defined as something that gathers data about the state of infrastructure/apps and performance traces in one way or another (https://thenewstack.io/monitoring-and-observability-whats-the-difference-and-why-does-it-matter/).
Or, according to honeycomb.io:
A large ecosystem of products such as New Relic, HP, and AppDynamics has evolved. All these tools are perfectly fit for low-level and mid-level monitoring or for detangling performance issues.
However, they cannot handle queries on data with a high cardinality and perform poorly in the case of problems that are related to third-party integration issues or the behaviour of large complex systems with swarms of services working in modern virtual environments.
Actually, they aren’t. But only if you know when and where to watch. Otherwise, it’s better to watch YouTube.
Dashboards do not scale.
Imagine a situation where you have a bunch of metrics that are related to your infrastructure (for example, cpu_usage/disk quotas) and apps (for example, JVM allocation_speed/GC Runs), etc. The total number of those metrics can easily grow to thousands or tens of thousands. All your dashboards are green, but then a problem occurs in a third-party integration service. Your dashboards are still green, but the end users are already affected.
You decide to add third-party integration service checks to your monitoring and get an additional bunch of metrics and dashboards on your TV set. Until the next case arises.
When asked why customers cannot open a site, the response often looks like this:

The Spaghettification of Dashboards
While adopting telemetry of different parts of the system is a common practice, it usually ends with a bunch of spaghetti drawn on a dashboard.
These are GitLab’s operational metrics that are open to the public.
And this is just a small part of a whole army of dashboards

It looks like a tapestry where it is easy to lose the thread.

Log aggregation tools such as ELK Stack or Splunk are used by a vast majority of modern IT companies. These instruments are amazingly helpful for root cause analysis or post mortems. They can also be used to monitor some conditions that can be derived from your logs flow.
However, it comes with a cost. Modern systems generate huge amounts of logs and an increase in your traffic can exhaust your ELK resources or raise Splunk’s billing rate to the moon.
There are some sampling techniques that can reduce the amount of so-called boring logs by several orders of magnitude and save all the abnormal ones. It can give a high-level overview about normal system behavior and a detailed view of any problematic events.

Usually, log lines reflect events that occur in the system. For example, making a connection, authenticating, querying the database, and so on. Executing all the phases means that a piece of work has been completed. Definition event as a logical piece of work can be seen as a part of Service Level Objectives related with particular service. By “service” I mean not only software services, but certain physical devices as well, such as sensors or other machinery from the IoT world.
It is also very complementary to domain-driven design principles. Isolation and the sharing of responsibilities between services or domains make events specific to each piece of work in every part of the system.
For example, login service events can be separated by successful_logins, failed_logins with own dynamic context.
Metrics and events should build a story around the processes in the system.
Events can be sampled in such a way that in the case of normal system behavior only a fraction of them are stored and all events that are problematic are stored as is. Events are aggregated and stored as key performance indicators based on the objectives of particular services.
It can bring together service objective metrics and their related metadata that leverages the connections between issues on a moment-to-moment basis.
Written with high cardinality in mind this data reveals the unknown-unknowns in the system.
Is this a form of software instrumentation? Yes. However, when you compare the amounts of data that come from debug-level logging and full instrumentation, splitting logs into events makes it possible to drink from a fire hose in the production environment without being drowned in data and costs.
“Defining an event as a piece of work could be seen as related to the objectives of a particular service.”

AI is a good buzzword for attracting startup investments. However, the devil is always in the details.
The problem of a fully machine learning based system (the so-called full AI approach) is that because it is constantly learning new behaviors, there is no reproducibility. If you want to understand why, for example, a condition resulted in an alert, you cannot investigate it, because the models have already changed. Any solution that relies on the constant learning of behavior faces this problem.
It is essential to optimize the system itself when you are operating with highly granular data or metrics, but it is very hard to do it without reproducibility.
For any sort of constant machine learning, you need a considerable amount of computational resources. Usually, this takes the form of batch processing sets of data. In the case of some products, the minimal requirements for processing 200 000 metrics are v32CPU and 64 Gb RAM. If you want to double the amount of metrics, you need another machine that meets the same requirements.
According to a master’s thesis written by Samreen Hassan Massak(not fully completed yet), the training process for thousands of metrics takes days’ worth of CPU time or hours’ worth of GPU time. You cannot scale it without blowing your budget.
Solutions like Amazon Forecast that function as batch processing services that ingest data and wait for computation to end are not fit for that.
Based on Google’s experience:
“The rules that catch real incidents most often should be as simple, predictable, and reliable as possible.”
landing.google.com/sre/sre-book/chapters/monitoring-distributed-systems
When models or rules are constantly changing, you lose understanding of the system and it works as a black box.
Let’s say you have thousands of metrics and if you want to have good Observability, you need collect high-cardinal data. Every heartbeat of the system will generate statistical fluctuations in your metrics swarm.
https://berlinbuzzwords.de/15/session/signatures-patterns-and-trends-timeseries-data-mining-etsy
The main lessons that can be drawn from Etsy’s Kale project:

Alerting about metrics anomalies will eventually lead to massive amounts of alerts and manual work playing with thresholds and hand-crafting filters.
Gaining Observability and bringing the unknown-unknowns into the spotlight requires highly granular data that can be categorized by data centers, build versions, services, platforms, and sensor types. Aggregating them in any combination is combinatoric by its nature.
Even if you carefully design your metrics and events, you will eventually end up with a rather large amount of them. When operating on this scale in real time, regular querying or batch jobs will have significant latency and overhead.
Any operation performed on an infinite stream of data is quite an engineering endeavor. You need deal with implications relating to distributed systems.
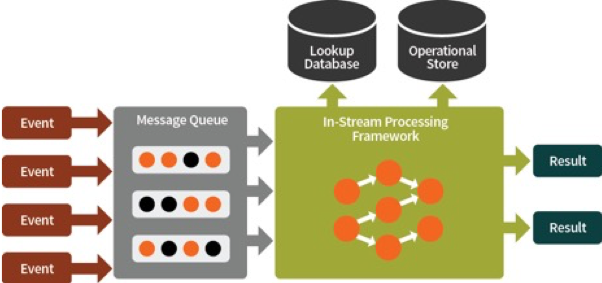
While monitoring events, service level objectives, or KPI on a high level, you need to be reactive and not constantly query your data, but instead operate on a stream that can scale horizontally and achieve a large throughput and speed without consuming an overwhelming amount of resources.
Some streaming frameworks, such as Apache Storm, Apache Flink, and Apache Spark, are oriented towards tuple processing and not towards time-series processing out of the box.
There are also problems with the semantics of distributed systems.
Let’s say you have a lot of deployments in different data centers. You can have a network problem and the agent storing your KPI metrics cannot forward them. After a while — let’s say 3 minutes — the agent sends this data to the system. And this new information should trigger an action based on this condition. Should we store this data window in memory and check for conditions not only backwards but forwards in time as well? How large should this desynchronization window be? Operating on thousands of metrics in real time makes these questions very important. You cannot store everything in the database in the case of stream-processing systems without losing speed.
Real-time stream analysis of time-series data in distributed systems is tricky, because the events concerning system behavior can be out of order and the conditions that could emerge based on this data depend on the order of events. This means that a at-least-once semantic can be achieved easily, but when only-once can be much much harder.

Great thanx to Charity Majors and Cindy Sridharan
Thanx to Sigrid Maasen for her help
It has gained a lot of attention recently.

What is Observability?
There are a lot of discussions and jokes about this term. For example:
- Why call it monitoring? That’s not sexy enough anymore.
- Observability, because rebranding Ops as DevOps wasn’t bad enough, now they’re devopsifying monitoring, too.
- The new Chuck Norris of DevOps.
- I’m an engineer that can help provide monitoring to the other engineers in the organization.
- > Great, here’s $80k.
- I’m an architect that can help provide observability for cloud-native, container-based applications.
- > Awesome! Here’s $300k!
Cindy Sridharan
What is the difference between monitoring and Observability if there is one?
Looking Back…
Years ago, we mostly ran our software on physical servers. Our applications were monoliths that were built upon LAMP or other stacks. Checking uptime was as simple as sending regular pings and checking the CPU/disk usage for your application.

Paradigm Shift
The main paradigm shift came from the fields of infrastructure and architecture. Cloud architectures, microservices, Kubernetes, and immutable infrastructure changed the way companies build and operate systems.

As a result of the adoption of these new ideas, the systems we have built have become more and more distributed and ephemeral.
Virtualization, containerization, and orchestration frameworks are responsible for providing computational resources and handling failures creates an abstraction layer for hardware and networking.
Moving towards abstraction from the underlying hardware and networking means that we must focus on ensuring that our applications work as intended in the context of our business processes.
What is Monitoring?
Monitoring is to operations essentially what testing is to software development. In fact, tests check the behaviour of system components against a set of inputs in a sandboxed environment, usually with a large number of mocked components.

The main issue is that the amount of possible problems in production cannot be covered with tests in any way. Most of the problems in a mature, stable system are unknown-unknowns that are related not only to software development itself, but also to the real world.
Black Box vs. White Box Monitoring
There are two approaches to monitoring.
In the case of black box monitoring, we treat the system or parts of it as a black box and test them outside. This could mean checking API calls, load time, or the availability of different parts of the system. In this case, the amount of information about and control over the system is limited.

White box monitoring refers to the situation, where we derive information from the system’s internals. This is not a revolutionary idea, but it has gained a lot of attention recently.

So, Observability is just another name for white box monitoring? Not quite.
Why We Need a New Kind of Monitoring
Often, a distinction is made between monitoring and the concept of Observability, with the latter defined as something that gathers data about the state of infrastructure/apps and performance traces in one way or another (https://thenewstack.io/monitoring-and-observability-whats-the-difference-and-why-does-it-matter/).
Or, according to honeycomb.io:
- “you are checking the status and behaviors of your systems against a known baseline, to determine if anything is not behaving as expected.”
- “You can write Nagios checks to verify that a bunch of things are within known good thresholds.”
- “You can build dashboards with Graphite or Ganglia to group sets of useful graphs.”
- “All of these are terrific tools for understanding the known-unknowns about your system.”
A large ecosystem of products such as New Relic, HP, and AppDynamics has evolved. All these tools are perfectly fit for low-level and mid-level monitoring or for detangling performance issues.
However, they cannot handle queries on data with a high cardinality and perform poorly in the case of problems that are related to third-party integration issues or the behaviour of large complex systems with swarms of services working in modern virtual environments.
Why Dashboards Are Useless
Actually, they aren’t. But only if you know when and where to watch. Otherwise, it’s better to watch YouTube.
Dashboards do not scale.
Imagine a situation where you have a bunch of metrics that are related to your infrastructure (for example, cpu_usage/disk quotas) and apps (for example, JVM allocation_speed/GC Runs), etc. The total number of those metrics can easily grow to thousands or tens of thousands. All your dashboards are green, but then a problem occurs in a third-party integration service. Your dashboards are still green, but the end users are already affected.
You decide to add third-party integration service checks to your monitoring and get an additional bunch of metrics and dashboards on your TV set. Until the next case arises.
When asked why customers cannot open a site, the response often looks like this:

The Spaghettification of Dashboards
While adopting telemetry of different parts of the system is a common practice, it usually ends with a bunch of spaghetti drawn on a dashboard.
These are GitLab’s operational metrics that are open to the public.
And this is just a small part of a whole army of dashboards

It looks like a tapestry where it is easy to lose the thread.

Log Aggregation
Log aggregation tools such as ELK Stack or Splunk are used by a vast majority of modern IT companies. These instruments are amazingly helpful for root cause analysis or post mortems. They can also be used to monitor some conditions that can be derived from your logs flow.
However, it comes with a cost. Modern systems generate huge amounts of logs and an increase in your traffic can exhaust your ELK resources or raise Splunk’s billing rate to the moon.
There are some sampling techniques that can reduce the amount of so-called boring logs by several orders of magnitude and save all the abnormal ones. It can give a high-level overview about normal system behavior and a detailed view of any problematic events.

From Logs to an Events Model
Usually, log lines reflect events that occur in the system. For example, making a connection, authenticating, querying the database, and so on. Executing all the phases means that a piece of work has been completed. Definition event as a logical piece of work can be seen as a part of Service Level Objectives related with particular service. By “service” I mean not only software services, but certain physical devices as well, such as sensors or other machinery from the IoT world.
It is also very complementary to domain-driven design principles. Isolation and the sharing of responsibilities between services or domains make events specific to each piece of work in every part of the system.
For example, login service events can be separated by successful_logins, failed_logins with own dynamic context.
Metrics and events should build a story around the processes in the system.
Events can be sampled in such a way that in the case of normal system behavior only a fraction of them are stored and all events that are problematic are stored as is. Events are aggregated and stored as key performance indicators based on the objectives of particular services.
It can bring together service objective metrics and their related metadata that leverages the connections between issues on a moment-to-moment basis.
Written with high cardinality in mind this data reveals the unknown-unknowns in the system.
Is this a form of software instrumentation? Yes. However, when you compare the amounts of data that come from debug-level logging and full instrumentation, splitting logs into events makes it possible to drink from a fire hose in the production environment without being drowned in data and costs.
“Defining an event as a piece of work could be seen as related to the objectives of a particular service.”

Why We Are Not Ready for Full AI Solutions
AI is a good buzzword for attracting startup investments. However, the devil is always in the details.
1. Reproducibility
The problem of a fully machine learning based system (the so-called full AI approach) is that because it is constantly learning new behaviors, there is no reproducibility. If you want to understand why, for example, a condition resulted in an alert, you cannot investigate it, because the models have already changed. Any solution that relies on the constant learning of behavior faces this problem.
It is essential to optimize the system itself when you are operating with highly granular data or metrics, but it is very hard to do it without reproducibility.
2. Resource consumption
For any sort of constant machine learning, you need a considerable amount of computational resources. Usually, this takes the form of batch processing sets of data. In the case of some products, the minimal requirements for processing 200 000 metrics are v32CPU and 64 Gb RAM. If you want to double the amount of metrics, you need another machine that meets the same requirements.
3. You cannot scale deep learning full automation yet
According to a master’s thesis written by Samreen Hassan Massak(not fully completed yet), the training process for thousands of metrics takes days’ worth of CPU time or hours’ worth of GPU time. You cannot scale it without blowing your budget.
4. Speed
Solutions like Amazon Forecast that function as batch processing services that ingest data and wait for computation to end are not fit for that.
5. Clarity
Based on Google’s experience:
“The rules that catch real incidents most often should be as simple, predictable, and reliable as possible.”
landing.google.com/sre/sre-book/chapters/monitoring-distributed-systems
When models or rules are constantly changing, you lose understanding of the system and it works as a black box.
Anomalies = Alerts?
Let’s say you have thousands of metrics and if you want to have good Observability, you need collect high-cardinal data. Every heartbeat of the system will generate statistical fluctuations in your metrics swarm.
https://berlinbuzzwords.de/15/session/signatures-patterns-and-trends-timeseries-data-mining-etsy
The main lessons that can be drawn from Etsy’s Kale project:

Alerting about metrics anomalies will eventually lead to massive amounts of alerts and manual work playing with thresholds and hand-crafting filters.
Why We Need a Streaming Approach
Gaining Observability and bringing the unknown-unknowns into the spotlight requires highly granular data that can be categorized by data centers, build versions, services, platforms, and sensor types. Aggregating them in any combination is combinatoric by its nature.
Even if you carefully design your metrics and events, you will eventually end up with a rather large amount of them. When operating on this scale in real time, regular querying or batch jobs will have significant latency and overhead.
Things to Be Considered
Any operation performed on an infinite stream of data is quite an engineering endeavor. You need deal with implications relating to distributed systems.

While monitoring events, service level objectives, or KPI on a high level, you need to be reactive and not constantly query your data, but instead operate on a stream that can scale horizontally and achieve a large throughput and speed without consuming an overwhelming amount of resources.
Some streaming frameworks, such as Apache Storm, Apache Flink, and Apache Spark, are oriented towards tuple processing and not towards time-series processing out of the box.
There are also problems with the semantics of distributed systems.
Let’s say you have a lot of deployments in different data centers. You can have a network problem and the agent storing your KPI metrics cannot forward them. After a while — let’s say 3 minutes — the agent sends this data to the system. And this new information should trigger an action based on this condition. Should we store this data window in memory and check for conditions not only backwards but forwards in time as well? How large should this desynchronization window be? Operating on thousands of metrics in real time makes these questions very important. You cannot store everything in the database in the case of stream-processing systems without losing speed.
Real-time stream analysis of time-series data in distributed systems is tricky, because the events concerning system behavior can be out of order and the conditions that could emerge based on this data depend on the order of events. This means that a at-least-once semantic can be achieved easily, but when only-once can be much much harder.
Desirable Features of a Monitoring Strategy According to the Google SRE Workbook
- “Modern design usually involves separating collection and rule evaluation (with a solution like Prometheus server), long-term time series storage (InfluxDB), alert aggregation (Alertmanager), and dashboarding (Grafana).”
- “Google’s logs-based systems process large volumes of highly granular data. There’s some inherent delay between when an event occurs and when it is visible in logs. For analysis that’s not time-sensitive, these logs can be processed with a batch system, interrogated with ad hoc queries, and visualized with dashboards. An example of this workflow would be using Cloud Dataflow to process logs, BigQuery for ad hoc queries, and Data Studio for the dashboards.“
- “By contrast, our metrics-based monitoring system, which collects a large number of metrics from every service at Google, provides much less granular information, but in near real time. These characteristics are fairly typical of other logs- and metrics- based monitoring systems, although there are exceptions, such as real-time logs systems or high-cardinality metrics.”
- “In an ideal world, monitoring and alerting code should be subject to the same testing standards as code development. While Prometheus developers are discussing developing unit tests for monitoring, there is currently no broadly adopted system that allows you to do this.”
- “At Google, we test our monitoring and alerting using a domain-specific language that allows us to create synthetic time series. We then write assertions based upon the values in a derived time series, or the firing status and label presence of specific alerts.”

Great thanx to Charity Majors and Cindy Sridharan
Thanx to Sigrid Maasen for her help