I had some experience in the matching engine development for cryptocurrency exchange some time ago. That was an interesting and challenging experience. I developed it in clear C++ from scratch. The testing of it is also quite a challenging task. You need to get data for testing, perform testing, collect some statistics, and at last, analyze collected data to find weak points and bottlenecks. I want to focus on testing the C++ matching engine and show how testing can give insights for optimizations even without the need to change the code. The matching engine I developed can do more than 1’000’000 TPS (transactions per second) and is 10x times faster than the matching engine of the Binance cryptocurrency exchange (see one post on Binance Blog).
What is the matching engine?
The matching engine is the heart of the cryptocurrency exchange as well as for other trading systems like stock exchanges. It is a point where the interests of buyers and the interests of sellers find each other and trades occur as a result of order matching. The matching engine holds a limit order book. It is the set of orders that haven't matched yet. Here is a simplified block diagram of exchange.
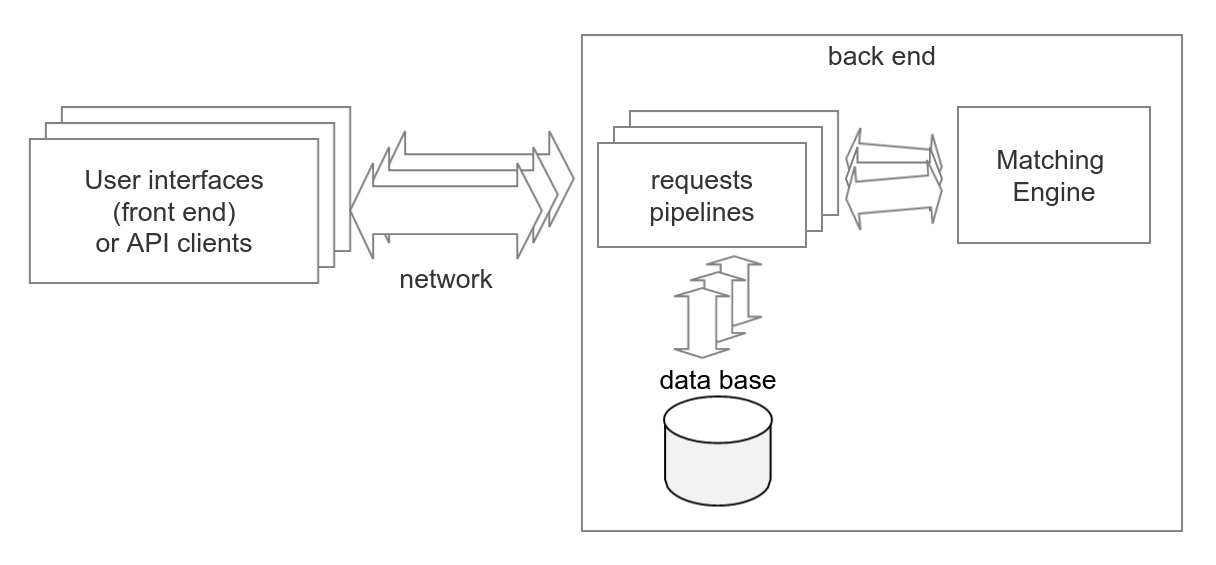
Fundamentally the matching process for one currency pair or other trading instruments is strictly sequential. Requests that came from users or API clients can be processed concurrently before they reach the matching engine. That is why the matching engine is the bottleneck for the throughput of the exchange. And the number of requests that the exchange can process per second is limited by the number of requests that the matching engine can process per second.
Testing data
To do testing we need some data. I want to be free with setting data parameters. So I developed the data generator which produces requests for the matching engine based on statistical models. Test data sample consists of 5’000’000 requests. Price is generated as a Markov chain stochastic model with Pareto distribution. This model produces a quite natural price chart.
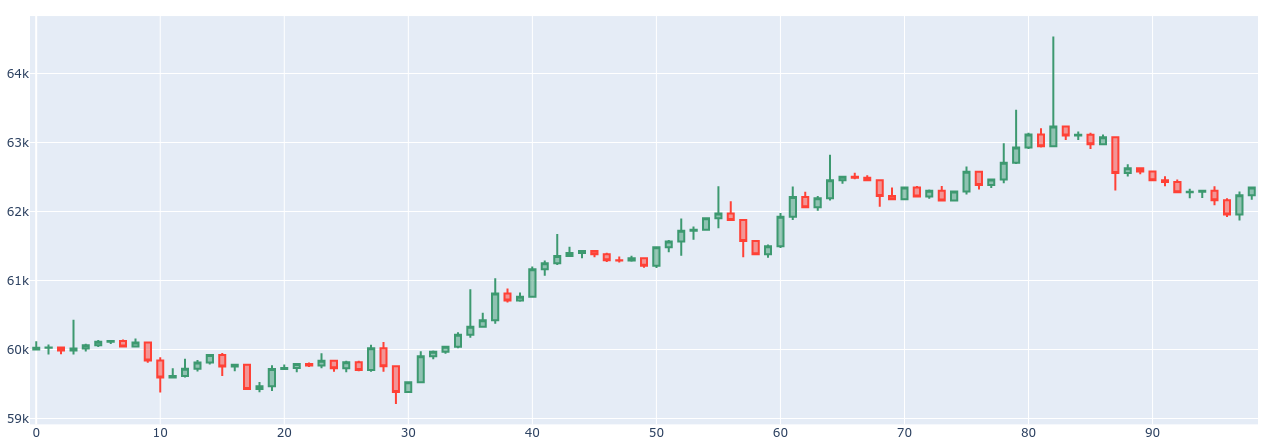
The starting price is 60’000 and the price step is 1. The orders are generated to follow the price and to get desired target values such as the number of orders in the limit order book, a proportion of the orders of different types, and etc. The average size of the limit order book for the test data is 10’000 and the average number of active stop orders is 1’000. And proportions of the different type orders are the next.
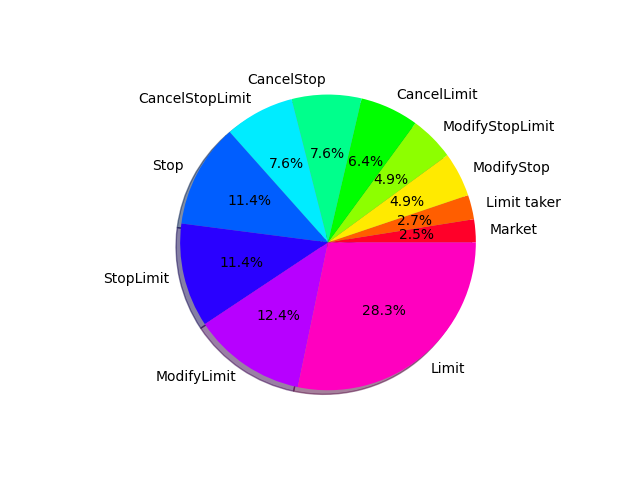
There is the next meaning of the order types. The Market orders are the orders to buy or sell at the best market price. The Limit order is the order to buy or sell at the defined limit price and that does not cross the limit order book instantly and does not produce trades in response. The Limit taker order is the limit order that crosses the limit order book and produces trades. The Stop order has a stop price and triggers when the current market price crosses the stop price. The Stop order converted to Market order when triggered. The StopLimit order is the stop order that is converted to Limit order on triggering. The ModifyLimit, ModifyStop, ModifyStopLimit orders are the orders to change price or amount in correspondent orders that are held by the matching engine. The CancelLimit, CancelStop, CancelStopLimit orders are orders to cancel correspondent orders.
Latency measurement
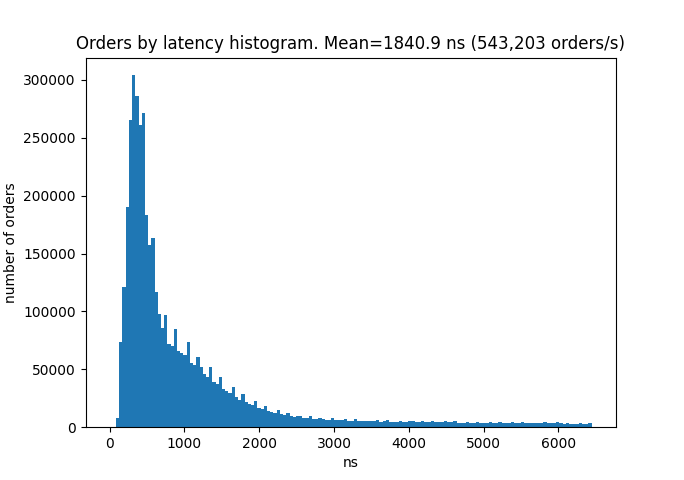
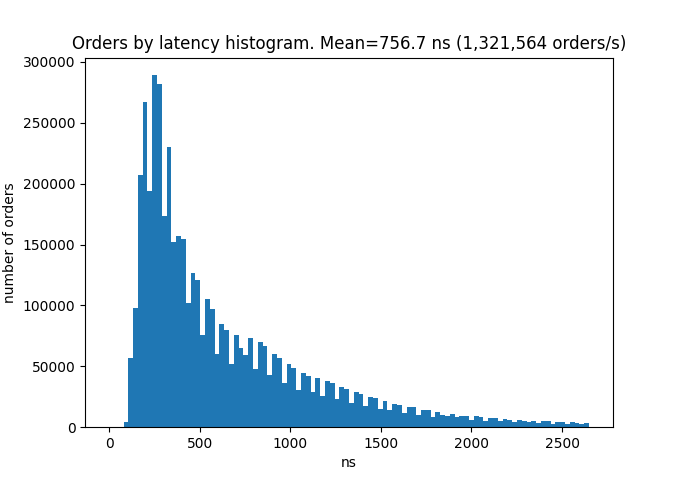
To measure throughput I save the time points for each request when it enters the matching engine. The latency for processing one request was calculated as the difference of two such consecutive time points. I run the test on the AMD Ryzen 9 3900X processor mounted on the Prime X570-PRO motherboard. This is a histogram for the latencies.
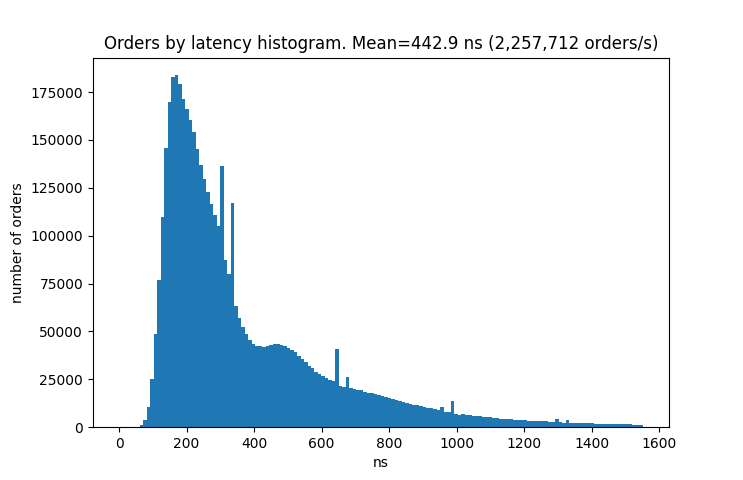
The average latency is 442 nanoseconds per order and this corresponds to about 2 million orders per second throughput. One request can produce zero or multiple trades. It is interesting to see how latency depends on the number of trades triggered by one request. And here is the chart.
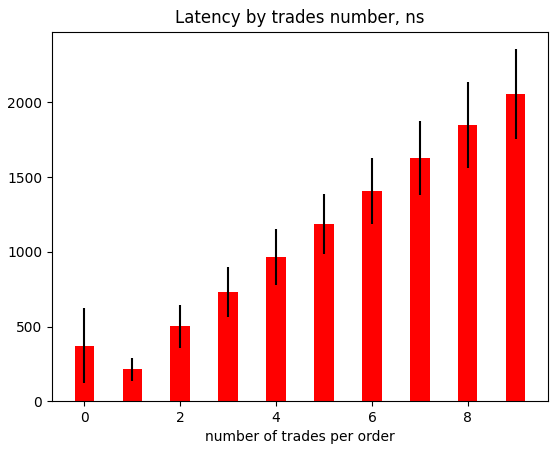
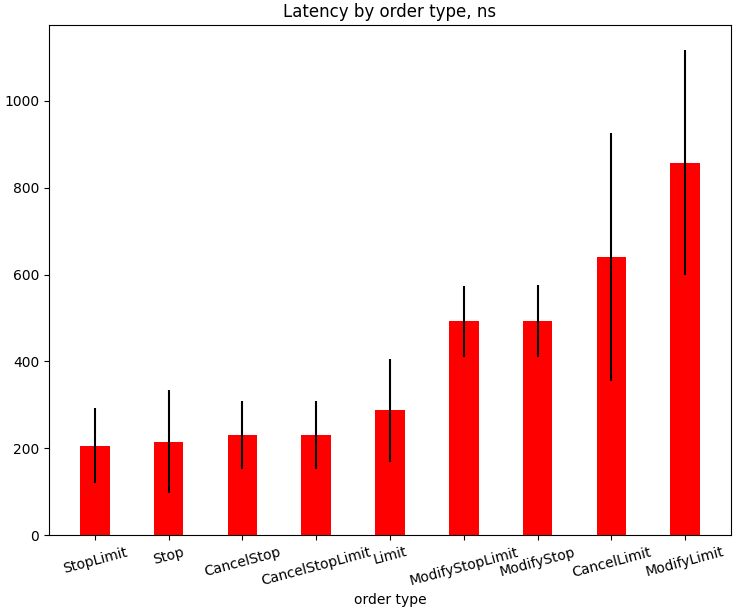
As we can see there is linear dependency and to process a request there are additional 220 nanoseconds needed per one additional trade. The total amount of trades done during this test is 1.7 million trades. There is another interesting chart that shows latencies for each type of order. The only requests which produce zero trades were taken into account for this chart.
Stress testing
It is time to do some stress testing. Let’s 10 times increase the average number of orders in the Limit Order Book. And let’s denote this test as Test B (the first test will be Test A). The average size of the limit order book for the test B data is 100’000 and the average number of active stop orders is 10’000. Let’s look at the histogram for the latencies.
As we can see the throughput was 4 times lower and is about 500’000 orders per second. Let’s examine what is the reason for such a dramatic speed down. Here is the chart for latency depends on the number of trades triggered by one request.

There are additional 350 nanoseconds needed per one additional trade to process a request. It is 61% bigger than in Test A. Also, there are latencies for requests with zero trades increased by 270% and the standard deviation for these latencies is much bigger (see error bar on the chart). So, it is some problem with requests that produce zero trades. Let’s look at latencies for each type of order for these requests.
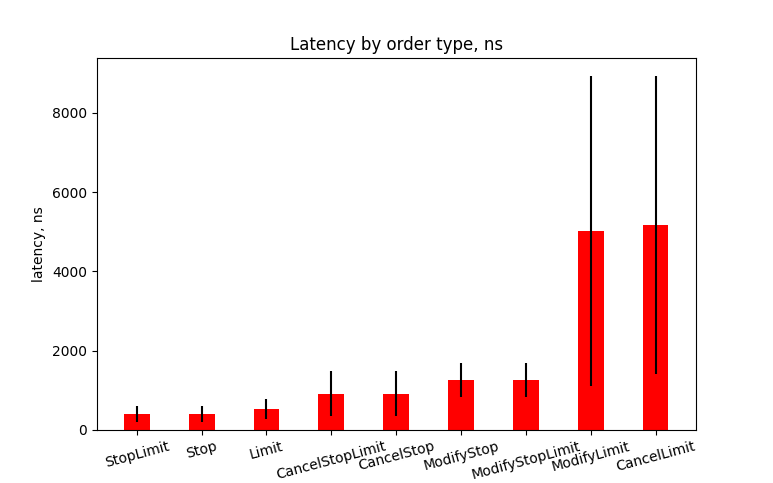
And here we can see that latencies for the ModifyLimit and the CancelLimit orders were increased more than 5 times. This is a useful hint for optimization. Processing the orders that share the same price in the Order Book is different for the ModifyLimit and the CancelLimit orders. This part should be optimized by choosing better data structures and algorithms. To prove the relation of performance drop with a number of orders that share the same price in the Order Book I plot the next chart. It shows how latencies for the ModifyLimit and the CancelLimit requests depend on the number of the orders in the Limit Order Book with the same price.
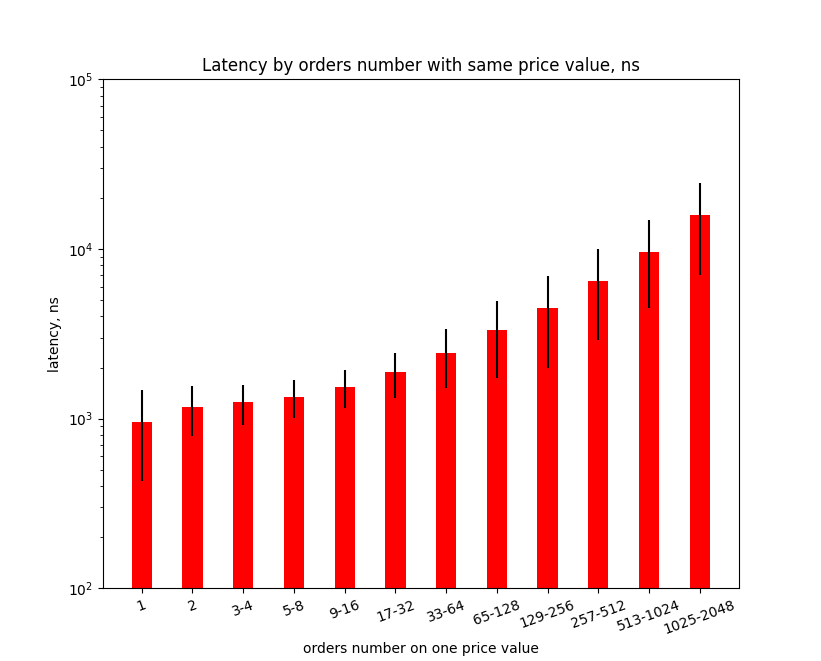
This chart shows that to cancel the order on price X there are about 1000 nanoseconds needed if the Order Book has only one order with price X. And there about 10’000 nanoseconds needed if the Order Book has 1000 orders with price X. This performance issue can be fixed even without changing the matching engine. I prepared data for Test C by changing only one parameter of the Test B data. I lowered the price step 10 times and use 0.1 value. By lowering the price step the number of orders with the same price will proportionally be lowered. The next chart shows the latencies histogram for Test C.
As we can see, adjusting one parameter increases the performance 3 times.
Conclusion
The matching engine can process more than 1 million requests per second even with large order books with 100’000 limit orders. These are quite impressive numbers and I would like to see such numbers on the websites of the top cryptocurrency exchanges.

Oleksii Zaderykhin
Senior Software Engineer
