Как стать автором
Обновить

Affordable as a Bus, Comfortable as a Taxi: A Promising Type of Public Transport for Large and Medium-Sized Cities.Part3

Уровень сложностиСредний
Время на прочтение32 мин
Количество просмотров1.3K
Автор оригинала: Sergey Kovalenko


Translation provided by ChatGPT, link to the original article in Russian

Link to Part 1: «Preliminary Analysis» (ру / eng )
Link to Part 2: «Experiments on a Torus» (ру / eng )
Link to Part 3: «Practically Significant Solutions» (ру / eng )
Link to «Summary» (ру / eng )

1 Playing Diplomacy


1.1 What this work is about


You're reading the third and final article in a series dedicated to minibus route schemes that would allow you to travel reasonably quickly, inexpensively, and most importantly, without any transfers, from any intersection to any other within a large city. You'll see many graphs, formulas, and figures below, but before we get to the technical part, I'd like to discuss the challenge of implementing this idea and invite you to participate in solving it.

1.2 A puzzle for the talented and brave (Eccentrics are welcome: 🎶)


I propose an adventure,
I propose a game,
I propose that you become part of a positive change in the lifestyle of almost a billion people around the planet,
I can't do this alone.
To start, I need your help with the following:

One of the pioneers of cybernetics and a medical doctor, Ross Ashby, put forth the idea that the main task of intelligence is to battle variety. Living beings and social institutions attempt to narrow down future possibilities to the desirable ones, try to hinder or compensate for the flow of information directed at them, specifically, they create informational barriers (from a turtle's shell to anti-spam programs). If you want to influence something intellectual, you will have to overcome its informational resistance. This is a natural law — almost a mathematical one, and its existence in our world should be taken as a given.

Now I have a solution, albeit a model one, but good enough, and the next step I see is to try and overcome the information barrier. We need to make the topic of non-stop public transportation a subject of public discussion, a focus for groups potentially interested in its implementation. From there, we can talk about creating a research group that will seek solutions for real cities, and its funding.

If you have ideas, reasonable advice — express them in the comments. If you are ready to participate personally — send me an email with your proposals to my email address: magnolia@bk.ru.

I won't be able to pay for your work immediately, but I can make the following public promise. If successful, I will undoubtedly be approached for technical consultations. I won't provide any until the work you've done, which has market value and was aimed at achieving results, is paid fivefold. If we fail, each of our efforts will remain unpaid. Risk demands reward!

I respect your need for self-realization. If you join the project, your participation and your work will be as public as you wish.

Now let me express my, albeit not very mature, vision of what we presumably have to work with.

1.3 The playing field and the distribution of forces (🎶)


Let's start with good news.

Market size.
The estimates I provide in this article show that the non-stop scheme can already be attempted in cities with a population of 1 million people. Around 1 billion people live in million-plus cities around the world. If the daily transport expenses of their average resident are estimated at $3, we have a suitable market for implementation amounting to roughly 1,000,000,000,000 ($1 trillion) per year — this is approximately a third of France's total GDP for 2021. I have a humble assumption that capital of such magnitude is a sufficient incentive for changes in the economies of entire countries and sectors of global industry. Now, let's discuss our little zoo of interested parties.

Large city residents.
Probably the most interested and at the same time the least influential group. With the implementation of bus taxi, they would gain several dozen minutes of personal time per day, comfort and simplicity of moving around the city, free roads, less noise and air pollution. They have collective political influence on municipalities. The media and actions of municipalities can influence this group itself.

Large city municipalities.
A key element of the mosaic, seemingly the most influential and least interested. It is city administrations that provide access to research data and make decisions about transport reform. In an ideal world, they could only gain political points from all this. In reality, various lobbies and informal agreements should be taken into account, which can both contribute (for example, from the side of minibus manufacturers) and hinder (owners of the previous public transport) the implementation of the technology. An extremely positive scenario is possible when the mayor and his team turn out to be ideological innovators.

Car and bus manufacturers.
A very interesting game situation is unfolding here. If a comfortable bus taxi appears, then on the one hand, it will create competition for cars, and these firms will inevitably suffer losses, and on the other — a new sizable market for the production and maintenance of a large number of special type minibuses will be formed. Potentially, if car manufacturers acted as a whole, they could block the introduction of bus taxi. However, if they do so, each of them will have a huge incentive to cheat and enter the new market before the others. The first one to start mass-producing minibuses for shared taxi will get all the bonus from capturing the new market, and the losses from reducing the old one — will share among everyone. Blocking is an unstable situation, and representatives of the auto industry will try to avoid it, and I will help them do it :)

Companies and startups in the urban passenger transportation market.
This is also an interesting group. The game situation for old players resembles the game situation for car manufacturers, but this time it is significantly more favorable. The difference is that bus taxi potentially can attract a significant part of those who used to drive a car themselves, hence the changes are beneficial. On the other hand, just like for car manufacturers, if a passenger transport operating company decides to continue working in the old way, it runs a huge risk of being pushed out of its old niche. There's huge growth potential for quick and flexible startups in terms of organizational decisions.

These are the ones who will directly use the bus taxi routing technology, so they will try in every possible way to pull the blanket over themselves, patent everything and keep it secret. They influence municipalities through lobbying and affect the mood of city residents through job availability.

Research groups and universities.
«Mostly harmless». When thinking about a structure capable of influencing and being receptive to influence, I regard university research groups with a great deal of skepticism. Current policy forces them to focus on publishing a number of articles rather than achieving practical results. At the same time, I admit that there are individual outstanding teams and personalities with whom it is worth establishing bilateral contact.

1.4 Vision of the future and my personal goals: option 0


The solution that exists now is only suitable for grid cities, and the question of its generalization to cities of other types requires research. I assume that such generalizations exist, and I even understand the direction in which to move. But all of this is a voluminous painstaking work, and it would be foolish on my part to try to do it alone. A research group is needed. Even if we're talking about implementing the already developed bus taxi scheme in real grid cities, which do exist, a million little nuances and problems will inevitably arise «on the ground» that also require a research group to solve. I think it would be interesting for me to take on the task of creating and coordinating such a group, and my presence in it will speed up the research process.

My position is that the results of the research should be open, and the technology should be accessible to everyone. I don't need a billion, my life is worth more and there are still many mysteries in it that I would like to have time to solve. Of course, it's difficult to fit such a mindset into the modern world of capital, where industrial knowledge is tried to be either turned into property or kept secret. But it seems I have come up with a way to solve this problem.

Most likely, the main interested parties in the research results will be firms capable of producing new types of buses, and firms that will directly engage in passenger transportation. How can they be made to financially support an independent research group without transferring the rights to the research results?
My idea is to sell these firms the right of embassy. Here's how I see it.

An independent research group has a core team of its permanent employees with fully transparent and open research tasks for all its members. Periodically, let's say every half a year or a year, the research results are published for the rest of the world. If a certain company is interested in obtaining more recent information, as well as training its personnel, it can buy from the independent research group the right of embassy for its representatives. With this right, the company is allowed to place 3-5 of its own employees within the independent research group, who will automatically gain access to all the information inside and, if desired, can join the research projects themselves.

I'm not the biggest expert in game theory, but it seems that in the just described scheme all key interested firms would prefer to buy the right of embassy.

1.5 Immediate necessary actions


Among the first things I see are:
a) translation into English;
b) peer review;
c) search for some minimal source of money;
d) the question of English-language platforms where the translated articles can be published.
f) adaptation of the text for mainstream media;
g) search for contacts within the community of architects and urban planners.

If you have any thoughts on any of these points, please share them.

As for the translation, I know a translator with a good knowledge of mathematics and economics, who has lived in the UK for a long time and therefore understands the peculiarities of Western culture. She translated «А City without Traffic Jams» for me. At that time, I paid for her work: translation together with editing.
Now I need patrons.
The cost of translating one article is about 20,000 rubles.
As a token of gratitude, the patron's name (or the name of the sponsoring organization) will be indicated in the English and Russian versions of the article before the author's signature.

Well, that's enough diplomacy for today, let's move on to the technical part of the article. This part is not standalone and to understand it, you will need to familiarize yourself with the two previous ones. If formulas do not display correctly, try refreshing the page several times.

Practically significant solutions.


What is the problem, exactly?


Let's suppose we need to design a bus service scheme within a certain rectangular grid city on a plane. How can we do it in the best way possible?

Coming full circle, we return to the very question we began with in Part 1, but now we have new knowledge that will allow us to construct a network of bus route corridors such that:

1) the bus stops will cover the entire city with a square grid with a cell size of $d \times d$, where $d$ is the block size;
2) from any stop to any other, you can travel without changing buses;
3) traveling by bus around the city, on average, will be no more than $(1 + \lambda)$ times more time-consuming than by private car or personal taxi;
4) the average number of passengers in the cabin will be such that the cost of trips on our bus taxi will be close to the cost of trips on a regular city bus.

2 Bus Taxi with a Network of Simple Corner Corridors


2.1 Network of Upper Corners


Let's assume our city has a size of $L_h \times L_w$ and is already divided by the grid $\{S_{h,w}\}$, $1 \leq h \leq H$, $1 \leq w \leq W$ into squares of size $ \Delta l$. Between any two cells $S_{h’,w’}$ and $S_{h’’,w’’}$ of the grid $\{S_{h,w}\}$ such that they do not lie in the same row or column, exactly two $\Gamma$ -shaped shortest cell paths can be built from $S_{h’,w’}$ to $S_{h’’,w’’}$. What if we extend these paths up to the borders of the grid $\{S_{h,w}\}$?
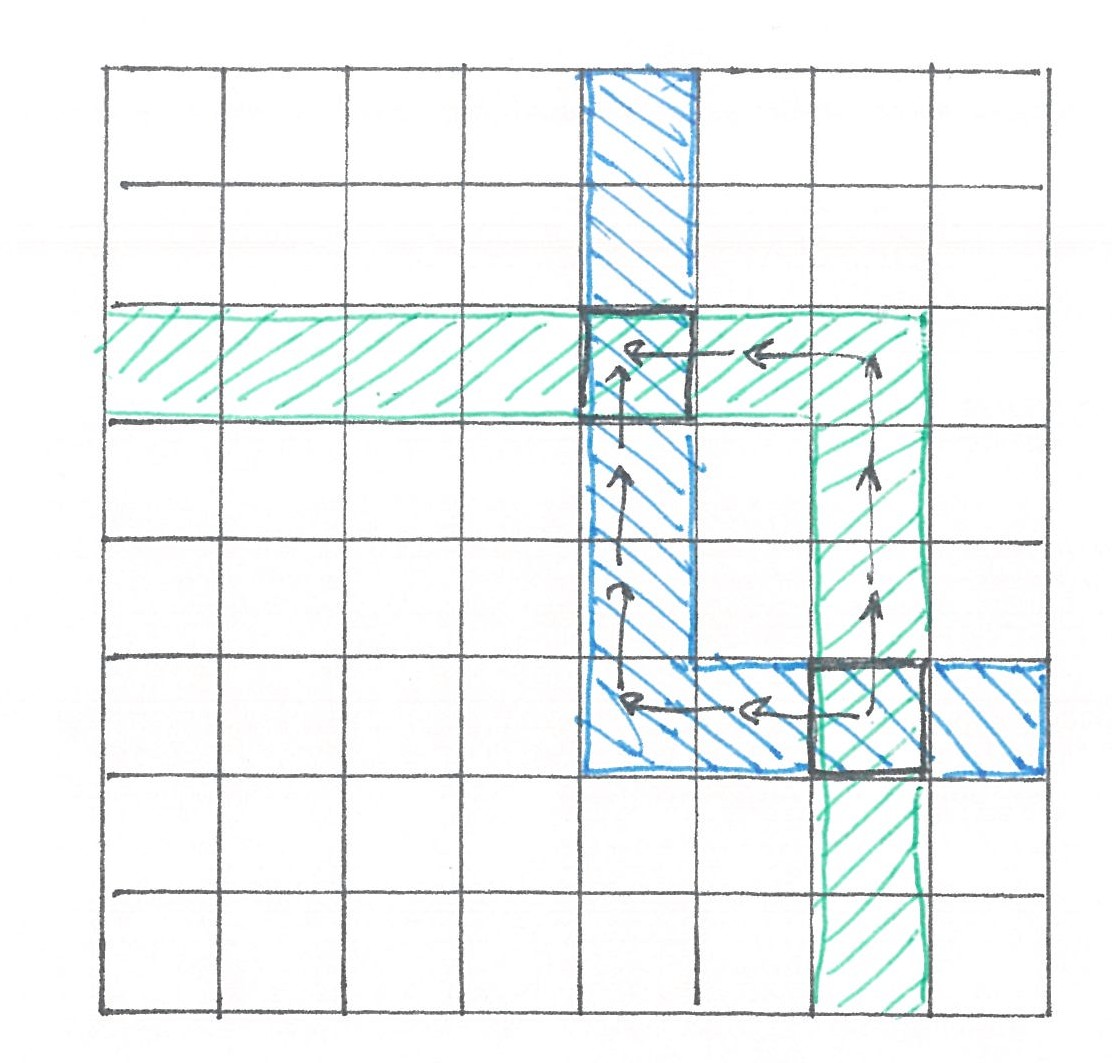
image

Fig 1

We will call any $\Gamma$ -shaped cell path that starts and ends at the border of ${S_{h,w}}$ a 'corner' path. It's easy to verify that each segment of a corner path is a geodesic segment of it. In turn, at least two corner paths pass through any pair of cells $S_{h’,w’}$, $S_{h’’,w’’} in\ {S_{h,w}}$: at least one of them abuts the upper border of the city and at least one — the lower. From these two facts, for example, it follows that the set of $“Uppercorners”$ of all those corner cell paths whose vertical segments abut the top edge of the city, and the set of $“Lowercorners”$ of all those corner cell paths whose vertical segments abut the lower edge, both form geodesically connected networks of route corridors. The competition indices for both these networks are close to 1: competition in them only exists for the transportation of passengers between those pairs of cells that are in the same column or the same row.

Let's build and examine the characteristics of a bus taxi with the $"Uppercorners"$ network.

2.2 Number of passengers on the bus depending on its position inside the assigned route corridor


When we considered bus taxi with rectangular routes on the torus (Chapter 3, Part 2), we were dealing with a nearly constant expected number of passengers in the cabin of each bus over time. For a bus taxi with a network of corner routes, everything is a bit different. Let $\pi$ be a corridor from $“Uppercorners”$ that starts in the cell $S_{y,0}$ and ends in $S_{0,x}$ (in this case, the row count is taken from top to bottom). The corner point for $\pi$ will be the cell $S_{y,x}$. As in the case of a network of large rectangles on the torus, we can neglect passengers whose travel routes are within one row or one column, since there are few of them overall and there is a lot of competition for them. Under such consideration, all customers of the bus following the route $\pi$ from $S_{y,0}$ to $S_{0,x}$ will board it in the first $(x-1)$ cells of the horizontal segment $\pi$ and disembark in the last $(y-1)$ cells of the vertical segment.
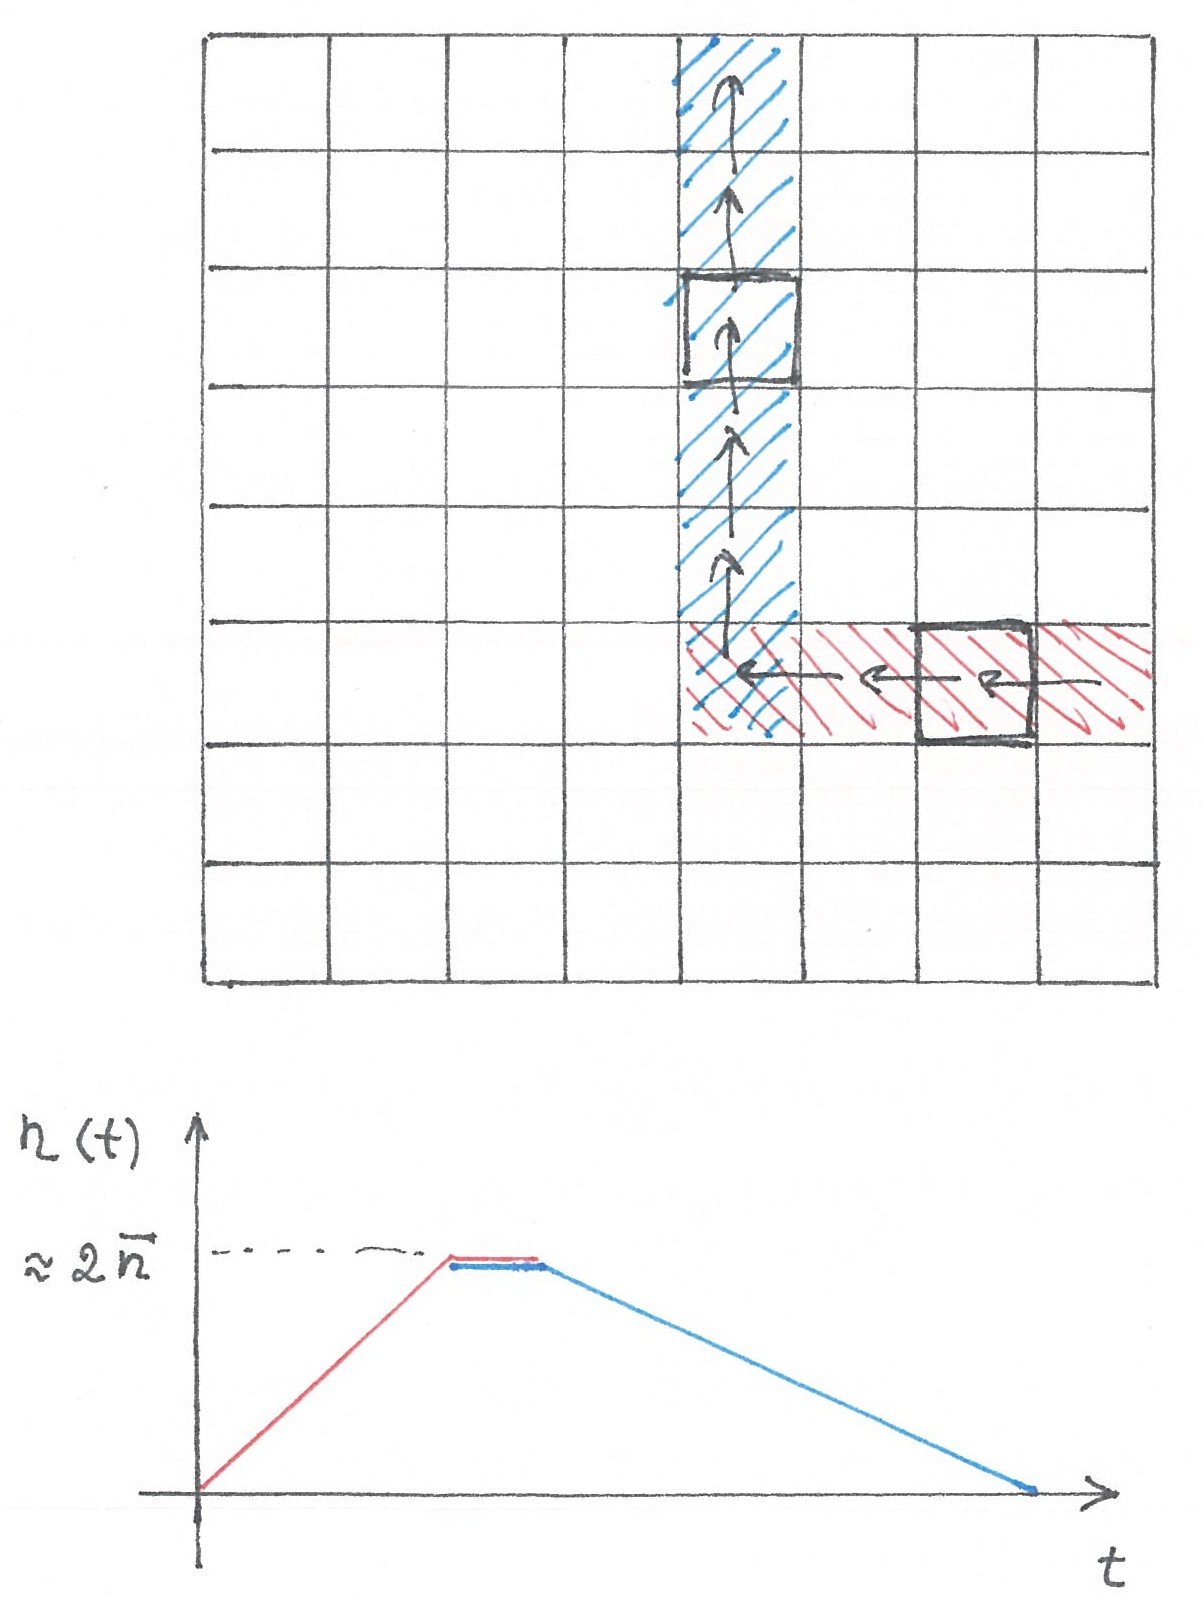
image

Fig. 2

In a city model with uniform access, the average flow of travel from each cell of the horizontal segment to each cell of the vertical segment will be the same. The uniformity of flow means that on the horizontal segment $\pi$, the expected number of passengers in the bus cabin will grow linearly, and on the vertical — decline linearly. As a consequence, the dependence of the expected bus load on time will be described by a graph of approximately triangular shape.

For further analysis, we will need some additional notations. Let $n_{pass}(x,y)(t)$ be the expected number of passengers at moment $t$ inside the bus assigned to the corner corridor of size $ x \times y $. Next, $n_{pass}(x,y)$ is the value of $n_{pass}(x,y)(t)$ averaged over a long period of time $T$, and finally $n_{pass}$ is the value of $n_{pass}(x,y)$ averaged over all buses in the city.

The maximum expected number of $n_{pass}(x,y)(t)$ passengers in the bus falls on the moment (moments) $t^0$, when the bus has already picked up all its passengers on the horizontal segment, but has not yet dropped anyone off on the vertical segment (or vice versa when traveling in the opposite direction). In other words, the maximum of $n_{pass}(x,y)(t)$ is achieved when it passes the corner zone $\pi$:

$max_t n_{pass}(x,y)(t) = \Delta T xy \sigma (\Delta l)^4/L^2 \ \ \ \ \ (1)$

where $\sigma$ is the number of new travelers appearing in the city area of unit area per unit time.

Since the graph of $n_{pass}(x,y)(t)$ has a triangular shape, its time average is half of the maximum, that is:

$n_{pass}(x,y) = 1/2\ max_t n_{pass}(x,y)(t) = 1/2\ \Delta T xy \sigma (\Delta l)^4/L^2 \ \ \ \ \ (2)$

2.3 Analysis of bus load within a single corner corridor


Let's try to maximize the average number of passengers inside a bus moving along $\pi$. Let's assume for now that the cell size $\Delta l$ has already been chosen. In this case, the only parameter we can control is the interval between buses, $\Delta T$. Clearly, the larger $\Delta T$, the greater $n_{pass}(x,y)$, but if we take $\Delta T$ too large, bus taxi journeys will become too long compared to journeys by private car. Let's express the difference in time between the average journey by car and by bus taxi.

The average amount of time a traveler spends waiting for the next bus is $\Delta T/2$. Next, we will assume that the bus uses the same traversal algorithm as in paragraph 4.3 of part 2. In this case, each bus stop is associated with a lateral maneuver, which extends the path of each passenger on average by $\Delta l/3$. On average, a passenger will participate in half of all stops where the bus picks up and on average half of all stops where the bus drops off its clients during one trip. If we neglect acceleration/deceleration time and boarding/alighting time, then a bus ride will be longer than a trip by private car on average by

$\Delta T/2 + max_t n_{pass}(x,y)(t) \cdot \Delta l/3v = \Delta T/2 + 2/3\ n_{pass}(x,y)\Delta l/v \ \ \ \ \ (3)$

If travelers were making trips between cells of the corner corridor $\pi$ by private car, the average travel time would be:

$1/2\ (x + y) \Delta l/v \ \ \ \ \ (4)$

We require that, on average, additional time losses in bus taxi travel do not exceed $\lambda$ of the average travel time by car. This requirement sets a limit on the maximum value of $\Delta T$:

$\Delta T/2 + 2 n_{pass}(x,y) \cdot \Delta l/3v = \lambda (x + y) \Delta l/2v \ \ \ \ \ (5)$

Using $(2)$, we get:

$\Delta T/2 + \Delta T xy \sigma (\Delta l)^4/L^2 \cdot \Delta l/3v = \lambda (x + y) \Delta l/2v \ \ \ \ \ (6) $

from which

$\Delta T = \lambda \frac {С_1 (x+y)}{1 + C_2xy} \ \ \ \ \ (7)$

where

$C_1 = \Delta l/v \ \ \ \ \ (8)$
$C_2 = 2/3\ \sigma (\Delta l)^5/L^2v \ \ \ \ \ (9)$

With these simplifications

$n_{pass}(x,y) = 1/2\ \Delta T xy \sigma (\Delta l)^4/L^2 = 3/4\ \lambda \frac {C_2xy(x+y)}{1 + C_2xy} \ \ \ \ \ (10)$

From equation $(7)$ we see that asymptotically, with proportional growth of $x$ and $y$, the optimal value of $\Delta T$ becomes smaller, that is, the longer and wider the corridor, the smaller the interval at which buses should run along it.

2.4 The total number of buses in the city


Let's denote the number of buses moving along a corridor $\pi \in “Uppercorners”$ of size $x \times y$ in any one of its two directions as $N_{bus}(x,y)$. If these buses didn't stop anywhere, for a single pass through $\pi$, they would have to cover a distance of approximately $\approx (x+y)\Delta l$. Each stop extends the path by an average of $\Delta l/3$. In total, there should be approximately $ 4n_{pass}(x,y)$ such stops for a single pass, meaning that the effective length of the bus route is approximately:

$l_{ef}(x,y) = (x+y + 4/3\ n_{pas}(x,y))\Delta l \ \ \ \ \ (11) $

To ensure the time interval between buses in the corridor $\pi$ is equal to $\Delta T$, the number of buses should satisfy the equation:

$N_{bus}(x,y) v \Delta T = l_{ef}(x,y) \ \ \ \ \ (12) $

from which we derive:

$N_{bus}(x,y) = \left (\frac {(x+y)}{\Delta T} + 4/3\ \frac {n_{pas}}{\Delta T} \right ) \Delta l/v \ \ \ \ \ (13)$

or

$N_{bus}(x,y) = \frac {1 + C_2xy}{\lambda} + C_2xy= \frac {1}{\lambda} + \frac {1+\lambda}{\lambda}C_2xy \ \ \ \ \ (14) $

For simplicity, we'll consider our city to be square: $ L_h = L_w = L$, $H = W = N$. For each pair of permissible x and y in the «Uppercorners» network, there are precisely two corridors (without considering directions) with a horizontal size of $x$ and vertical $y$. Moreover, each corridor $\pi \in “Uppercorners”$ has exactly two directions of movement, which implies that the total number of buses in the city is:

$N_{bus} = 4 \sum_{x=1}^N \sum_{y=1}^N N_{bus}(x,y) = 4 \sum_{x=1}^N \sum_{y=1}^N \frac {1}{\lambda} + \frac {1+\lambda}{\lambda}C_2xy \approx \frac {1}{\lambda} (4N^2 + (1 +\lambda)C_2N^4) \ \ \ \ \ (15)$

Substituting $N = L/\Delta l$ and $C_2 = 2/3\ \sigma (\Delta l)^5/L^2v$ into $(15)$, we have:

$N_{bus} = \frac {L^2}{\lambda} \left [\frac {4}{(\Delta l)^2} + 2/3\ (1 + \lambda) \Delta l \frac {\sigma}{v} \right ] \ \ \ \ \ (16)$

Operating each additional bus costs money, and if we want to make the ride price as low as possible, we should minimize the number of buses, $N_{bus}$. Differentiating $N_{bus}$ by the only parameter we control, $\Delta l$, we get the extremum condition:

$- \frac {8}{(\Delta l)^3} + 2/3\ (1 + \lambda)\frac {\sigma}{v} = 0 \ \ \ \ \ (17)$

from which:

$\Delta l = \left (\frac {12}{1 + \lambda} \right )^{1/3} \cdot \left (\frac {\sigma}{v} \right )^{1/3} \ \ \ \ \ (18)$

and

$N_{bus} = \frac {L^2 12^{1/3} (1+\lambda)^{2/3}}{\lambda} \cdot \left ( \frac{\sigma}{v} \right )^{2/3} \ \ \ \ \ (19)$

2.5 Average Equivalent Number of Passengers in a Bus


The average number of passengers in a bus itself is not really the variable that a business should strive for. Why? The average bus (or taxi) occupancy rate is influenced not only by how well the algorithm finds co-travelers, but also by how much this algorithm extends the path of each passenger. A simple example:

Let's assume that you have found a way to carry, on average, two clients in a personal taxi at once, but at the same time you have doubled the path of each client on average. It's easy to understand that for the same city, with the same demand for trips, you will need the same number of taxi cars as before. That is, in the situation just described, you did not receive any «benefits» from combining passenger trips.

Well, if the average number of co-travelers is a poor indicator, what should we strive for? Obviously, to reduce the number of buses. But how then to compare the efficiency of shared trips in different cities? To do this, we will use the «equivalent» average number of passengers in the salon, denoted as $inline$n_{pass}^$inline$. In essence, $inline$n_{pass}^$inline$ shows how many passengers, on average, one bus would have carried if the co-traveler selection algorithm did not extend the path of any of them.

Assuming that the average speed $\bar {v}$ along the corridors is the same for all buses in the entire city, the usual average $n_{pas}$ is expressed by the formula (paragraph 4.2 part 2):

$n_{pass} = \frac {P}{N_{bus} \bar {v}} \ \ \ \ \ (20)$

where P is the total transport load created by the city (paragraph 4.2 part 2). In our model, the average speed $\bar {v}$ of a bus moving along its assigned corridor is less than the maximum allowed speed v because its route is longer than optimal due to side maneuvers to stop points. To «subtract» the effect of path non-optimality, we replace $\bar {v}$ with $v$ in the previous formula and consider that

$n_{pass}^* = \frac {P}{N_{bus} v} \ \ \ \ \ (21)$

In a rectangular city of size $L \times L$, the average travel length along the shortest path is $2/3\ L$, therefore the transport load $P = 2/3\ \sigma L^3$. From this, we conclude that for the «Uppercorners» network, the average equivalent number of passengers a bus carries is:

$\frac {2}{3 \cdot 12^{1/3}} \cdot \frac {\lambda L}{(1 + \lambda)^{2/3}} \cdot \left ( \frac {\sigma}{v} \right )^{1/3} \approx 0.29 \frac {\lambda L}{(1+\lambda)^{2/3}} \cdot \left ( \frac {\sigma}{v} \right )^{1/3} \ \ \ \ \ (22)$

2.6 The Longest Travel Interval


We have established different bus intervals within different route corridors. This was done for the following reasons. Choosing a bus taxi, the traveler gets some allowed time surplus. In our model, this surplus is spent on waiting for the bus and the imperfection of the shared ride route. Within small-sized corridors, the intensity of travel is lower and, accordingly, the path of buses is «straighter». Hence, with the same value of $ \lambda $, we can make the traveler wait for the bus longer, in other words — increase the interval between buses and thereby slightly increase their load. Since the interval $ \Delta T = \Delta T(x,y) $ is a variable value, let's then determine its maximum value.

According to formula $(7)$

$ \Delta T = \lambda (\Delta i/v) \frac {(x+y)}{1 + C_2xy} \ \ \ \ \ (23)$

where

$ C_2 = 2/3\ \sigma (\Delta l)^5/(L^2v) \ \ \ \ \ (24)$

Let's make a substitution $ p = x \Delta l/L $, $ q = x \Delta l/L $, $ p, q \in [0,1] $:

$ \Delta T = \lambda L/v \frac {(p+q)}{1 + pq C_2 (L/\Delta l)^2} \ \ \ \ \ (25)$

Because:

$ C_2 (L/\Delta l)^2 = 2/3\ \sigma (\Delta l)^3/v \ \ \ \ \ (26)$

and we found that

$ - \frac {8}{(\Delta l)^3} + 2/3\ (1 + \lambda)\frac {\sigma}{v} = 0 \ \ \ \ \ (27)$

then

$ C_2 (L/\Delta l)^2 = \frac {8}{1+\lambda} \ \ \ \ \ (28)$

and

$ \Delta T = \lambda L/v \frac {(p+q)}{1 + \frac {8}{1+\lambda}pq} \ \ \ \ \ (29)$

At the point of maximum, the differential $ \Delta T (p,q) $ must be equal to zero, this requirement gives us two equations:

$ \left ( 1+ \frac {8}{1+\lambda}pq \right) - (p + q) \cdot \frac {8}{1+\lambda}p = 0 \ \ \ \ \ (30)$

$ \left ( 1+ \frac {8}{1+\lambda}pq \right) - (p + q) \cdot \frac {8}{1+\lambda}q = 0 \ \ \ \ \ (31)$

from where:

$ p = q = \left ( \frac {1 + \lambda}{8} \right )^{1/2} \ \ \ \ \ (32)$

and

$ \Delta T = \frac {\lambda L}{v} \cdot \left ( \frac {1 + \lambda}{8} \right )^{1/2} \ \ \ \ \ (33)$

2.7 Numerical estimates for nearly real cities


Let's write all our formulas together:

$n_{pass}^* \approx 0.29 \frac {\lambda L}{(1+\lambda)^{2/3}} \cdot \left ( \frac {\sigma}{v} \right )^{1/3} \ \ \ \ \ (34)$

$\Delta T \leq \frac {\lambda L}{v} \cdot \left ( \frac {1 + \lambda}{8} \right )^{1/2} \ \ \ \ \ (35)$

$\Delta l = \left (\frac {12}{1 + \lambda} \right )^{1/3} \cdot \left ( \frac {\sigma}{v} \right )^{1/3} \ \ \ \ \ (35)$

Let's take our standard $\lambda = 1/2$, and calculate what $n_{pass}^*$, $\Delta T$, and $\Delta l$ would be in real cities if they were cellular, square in shape, and implemented a uniform access migration model.

$n_{pass}^*(\lambda = 1/2) \approx 0.089 L \left ( \frac{\sigma}{v} \right )^{1/3} \ \ \ \ \ (36)$
$\Delta T (\lambda = 1/2) \leq 0.22 L/v \ \ \ \ \ (37)$
$\Delta l (\lambda = 1/2) = 2 \left ( \frac {\sigma}{v} \right )^{1/3} \ \ \ \ \ (38)$

For an idealized square New York (London, Moscow):
effective diameter $L \approx 28$ km,
permitted speed $v = 0.8$ km/min,
$\sigma \approx 33$ people/min sq km,
$n_{pass}^* (\lambda = 1/2) \approx 0.089 \cdot 28 (33/0.8)^{1/3} \approx 8.6$ people,
$\Delta l (\lambda = 1/2) \approx 2 \cdot (0.8/33)^{1/3} \approx 0.58$ km,
$\Delta T (\lambda = 1/2) \leq 0.22 \cdot 28/0.8 \approx 7.7$ min.

For an idealized square Berlin:
effective diameter $L \approx 30$ km,
permitted speed $v = 0.8$ km/min,
$\sigma \approx 13$ people/min sq km,
$n_{pass}^* (\lambda = 1/2) \approx 0.089 \cdot 30 (13/0.8)^{1/3} \approx 6.8$ people,
$\Delta l (\lambda = 1/2) \approx 2 \cdot (0.8/13)^{1/3} \approx 0.79$ km,
$\Delta T (\lambda = 1/2) \leq 0.22 \cdot 30/0.8 \approx 8.3$ min.

For an idealized square Paris:
effective diameter $L \approx 10$ km,
permitted speed $v = 0.5$ km/min,
$\sigma \approx 70$ people/min sq km,
$n_{pass}^* (\lambda = 1/2) \approx 0.089 \cdot 10 (70/0.5)^{1/3} \approx 4.6$ people,
$\Delta l (\lambda = 1/2) \approx 2 \cdot (0.5/70)^{1/3} \approx 0.39$ km,
$\Delta T (\lambda = 1/2) \leq 0.22 \cdot 10/0.5 \approx 4.4$ min.

For an idealized square Prague:
effective diameter $L \approx 23$ km,
permitted speed v = 0.8 km/min,
$\sigma \approx 8.3$ people/min sq km,
$n_{pass}^* (\lambda = 1/2) \approx 0.089 \cdot 23 (8.3/0.8)^{1/3} \approx 4.5$ people,
$\Delta l (\lambda = 1/2) \approx 2 \cdot (0.8/8.3)^{1/3} \approx 0.92$ km,
$\Delta T (\lambda = 1/2) \leq 0.22 \cdot 23/0.8 \approx 6.3$ min.

For an idealized standard square city of half a million people.
population $P = 500K$ people,
density $\rho = 5000$ people/sq km,
effective diameter $L = 10$ km,
permitted speed $v = 1$ km/min,
$\sigma \approx 17$ people/min sq km,
$n_{pass}^* (\lambda = 1/2) \approx 0.089 \cdot 10 (17/1)^{1/3} \approx 2.3$ people,
$\Delta l (\lambda = 1/2) \approx 2 \cdot (1/17)^{1/3} \approx 0.78$ km,
$\Delta T (\lambda = 1/2) \leq 0.22 \cdot 10/1 \approx 2.2$ min.

Exercise: Critique the solution just presented yourself.

3 Bus Taxi with a Network of Corner Corridors of Adaptive Width


3.1 Another Possibility for Improvement


Now we are going to modify the “Uppercorners” network so that the effective load of the buses circulating along it will be distributed a bit more evenly, and its average value will slightly increase.

Let a bus circulate along the corner corridor $\pi$ of size $x \times y$. The effective load of this bus is proportional to the product of the areas of the vertical and horizontal segments of $\pi$ and is expressed by the formula:

$n_{pass} \approx xyA$, where $A = \frac{1}{2} \Delta T \sigma (\Delta l)^4/L^2 \ \ \ \ \ (39)$

This formula shows that if the movement interval $\Delta T$ in all corridors is made the same, then the smaller the corner corridor sizes $x$ and $y$, the lower the load will be on the buses circulating along it. In the last chapter, in order to somehow compensate for the decrease in the load of buses when $x$ and $y$ are reduced, we allowed the movement interval $\Delta T$ to be different in different corridors. Why not go further and allow the width of their vertical and horizontal segments to be different in different corridors. To do this, let's allow the vertical and horizontal segment of the corner corridor to have a width of not one, but several cells at once. We will call such corner corridors “generalized.”

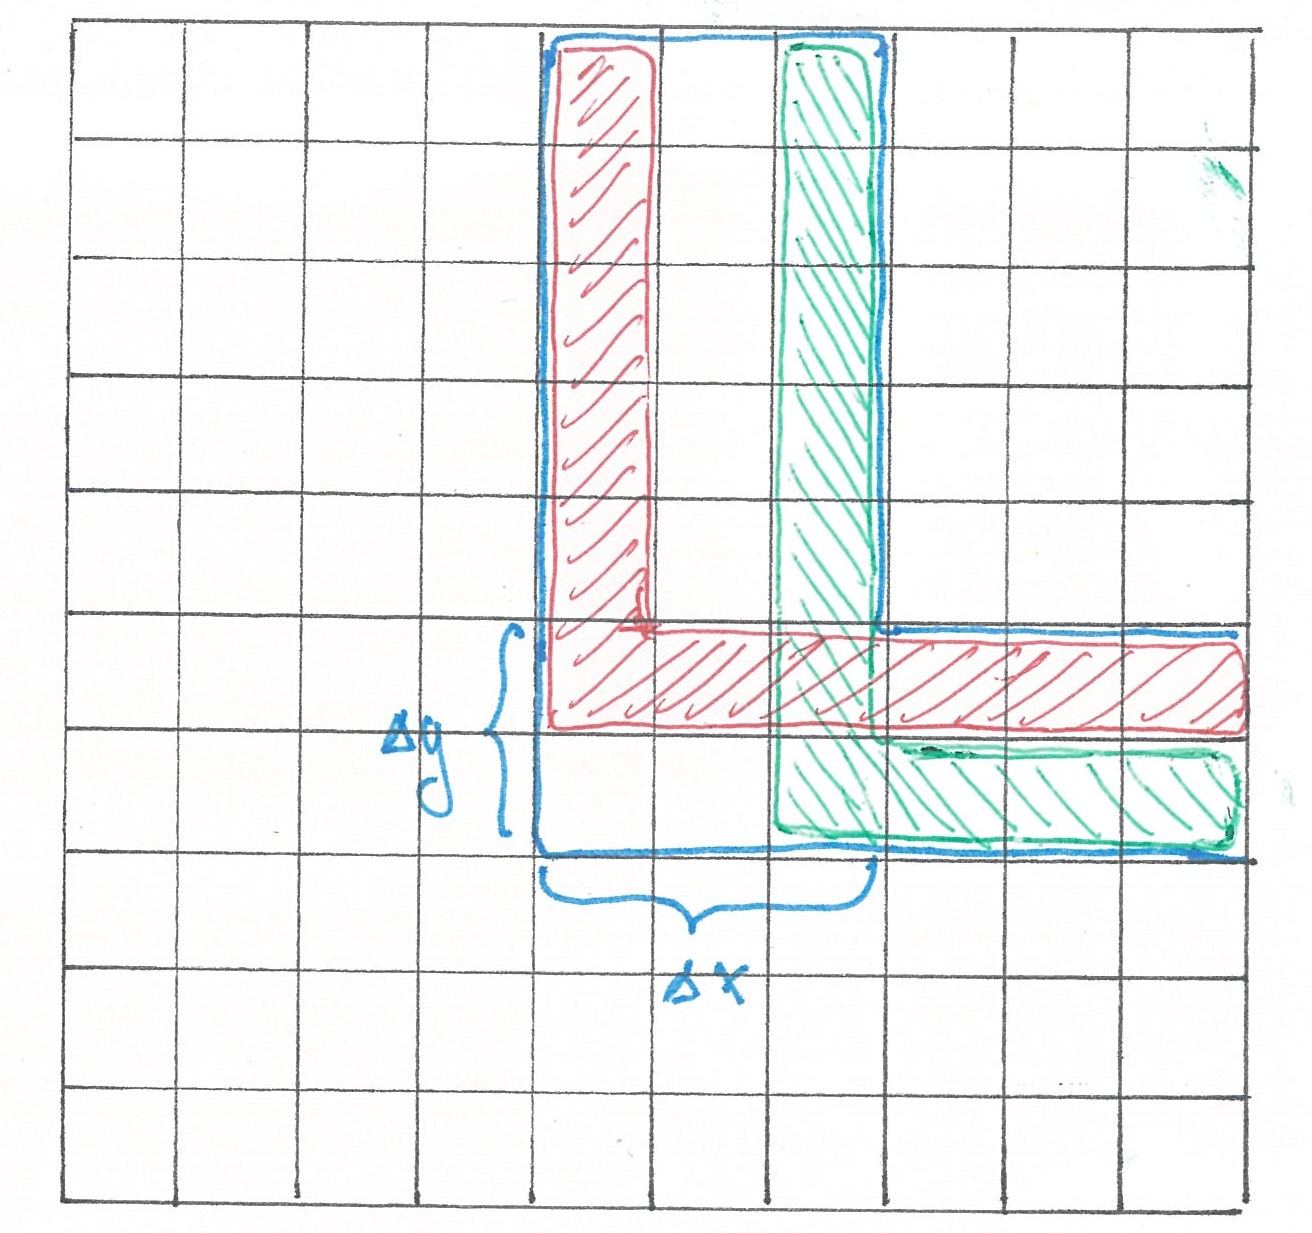
The width of the horizontal segment of the generalized corridor $\gamma$, expressed in cells, we will denote as $\Delta y$, and the vertical one — as $\Delta x$. As before, we will assume that a horizontal and vertical street road passes through the center of each cell, and passengers are picked up and dropped off exclusively at intersections. The maximum load of a bus circulating along $\gamma$ will be expressed by the formula:

$max_t \ n_{pass}(x,y,t) \approx A xy\Delta x\Delta y \Delta T(x,y) \ \ \ \ \ (40)$,

where the coefficient

$A = \sigma (\Delta l)^4/L^2 \ \ \ \ \ (41)$

does not depend on $x$ and $y$.

From $(39)$ it can be seen that reducing $x$ and $y$ can be attempted to be compensated by increasing $\Delta y$ and $\Delta x$.

3.2 Analysis of Bus Taxi Operation within One Generalized Corridor


Just like in the previous scheme, if the bus starts its movement from the horizontal segment of corridor $\gamma$, almost all its passengers will get in at the cells of the horizontal segment, and get out at the cells of the vertical segment. As in the previous scheme, the function of the expected number of passengers in the bus cabin $n_{pass}(x,y,t)$ over travel time will roughly have a triangular graph, with a maximum at the moment of passing the corner section. As a consequence, we have:

1) The average number of passengers per trip follows the formula

$n_{pass}(x,y) = 1/2/ max_t n_{pass}(x,y,t) =1/2\ \Delta T(x,y) xy\Delta x\Delta y \sigma (\Delta l)^4/L^2 \ \ \ \ \ (4)$

2) On average, a bus passenger will participate in about $n_{pass}(x,y)$ stops on the horizontal and about $n_{pass}(x,y)$ stops on the vertical segment $\gamma$.

Each bus stop within \gamma is associated with its preliminary lateral maneuver and causes additional travel distance. If the stop is made on the horizontal segment, the preliminary maneuver is bypassed by an excessive path of an average length of $\Delta y \Delta l/3$, and if on the vertical segment, then — $\Delta y \Delta l/3$. In the end, the bus will travel the horizontal segment $\gamma$ in about $(x\Delta l + n_{pass}(x,y)\Delta y \Delta l)/v$ units of time, and the vertical segment in $(y\Delta l + n_{pass}(x,y)\Delta x \Delta l)/v$. From this we have that the average speed of the bus along the horizontal section $\gamma$ will be equal to:

$\bar {v}{hor} \approx v \frac {x}{x + n{pass}(x,y)\Delta y} \ \ \ \ \ (5)$

and the average speed along the vertical:

$\bar {v}{ver} \approx v \frac {y}{y + n{pass}(x,y) \Delta x} \ \ \ \ \ (6)$

In relation to travelers, it will be fair if the average speeds on both sections turn out to be the same. This last condition leads us to the equation:

$\frac {\Delta y}{x} = \frac {\Delta x}{y} \ \ \ \ \ (7)$

From which in turn follows that:

$n_{pass}(x,y) = 1/2\ \Delta T(x,y) \frac {x^2}{y} (\Delta x)^2 \sigma (\Delta l)^4/L^2 \ \ \ \ \ (8)$

Let's now calculate the time that a passenger spends on the road. If a person traveling along $\gamma$ chooses a bus taxi, then on average, taking into account the wait for the bus, his trip will take:

$\Delta T/2 + [(x + y)/2 + n_{pass}(x,y)(\Delta x + \Delta y)/3] \Delta l/v \ \ \ \ \ (9)$

units of time. The average trip inside $\gamma$ by personal car would have taken on average:

$1/2\ (x + y)\Delta l/v \ \ \ \ \ (10)$

units of time. We demand that our bus taxi inside any \gamma on average be no more than $(1 + \lambda)$ times slower than a car. Ultimately, this requirement leads to the equation:

$1/2\ \Delta T + 1/3\ n_{pass}(x,y)(\Delta x + \Delta y)\Delta l/v =1/2\ \lambda (x + y)\Delta l/v \ \ \ \ \ (11)$

Let $p,q$ be arbitrary real numbers from the interval $[0, 1]$ such that $p + q = 1$. We put

$1/2\ \Delta T = p [1/2\ \lambda (x + y)\Delta l/v] \ \ \ \ \ (12)$

and

$1/3\ n_{pass}(x,y)(\Delta x + \Delta y)\Delta l/v = q [1/2\ \lambda (x + y)\Delta l/v] \ \ \ \ \ (13)$

then:

$\Delta T = p \lambda (x + y)\Delta l/v \ \ \ \ \ (14)$

$\frac {n_{pass} (x,y)}{\Delta T}(\Delta x + \Delta y)\Delta l/3v =q/2p \ \ \ \ \ (15)$

Substituting into $(15)$ $\Delta y = (\Delta x) \ x/y$ and the expression for $n_{pass}(x,y)$, we have:

$\frac {x^2(x + y)}{y}(\Delta x)^3 \sigma (\Delta l)^5/L^2v = 3q/p \ \ \ \ \ (16)$

from which:

$\Delta x = (3)^{1/3} \frac {y^{1/3}}{x^{2/3}(x + y)^{1/3}} (L)^{2/3} \left ( \frac {q}{p} \right )^{1/3} \left ( \frac {v}{\sigma} \right )^{1/3} (\Delta l)^{-5/3} \ \ \ \ \ (17)$

and

$n_{pass}(x,y) = 1/2\ \lambda p (x + y) x^2 (\Delta x)^2 \sigma (\Delta l)^5/L^2v \ \ \ \ \ (18)$

Using $(16)$ from $(18)$ we get:

$n_{pass}(x,y) = 1/2\ \lambda p \frac {y}{\Delta x} [(x + y) \frac {x^2}{y} (\Delta x)^3 \sigma (\Delta l)^5/L^2v] = 3/2\ \lambda q \frac {y}{\Delta x} \ \ \ \ \ (19)$

and finally:

$n_{pass}(x,y) = \frac {3^{2/3}}{2} \lambda L^{-2/3} p^{1/3}q^{2/3} x^{2/3}y^{2/3}(x + y)^{1/3} \ \ \ \ \ (20)$

3.3 Average adjusted number of passengers on the bus


Let's follow the template of the previous chapter. While passing in one direction through the generalized corner corridor $\gamma$ with dimensions $x$, $y$, $\Delta x$, $\Delta y$, the bus covers an effective distance:

$l_{ef}(x,y) \approx (x + y)\Delta l + 2n_{pass}(x,y) \left ( \frac {\Delta x \Delta l}{3} + \frac {\Delta x \Delta l}{3} \right) = (x + y)\Delta l + 2/3\ \frac {n_{pass}(x,y) \Delta x}{y}(x + y)\Delta l \ \ \ \ \ (21) $

Using $(19)$, we get:

$l_{ef}(x,y) \approx (1 + \lambda q)(x + y)\Delta l \ \ \ \ \ (22)$

Exercise: obtain $(22)$ logically without calculations.

Knowing the effective route length and the time interval between buses, we can calculate how many such buses are assigned to $\gamma$

$N_{bus}(x,y) = \frac {l_{ef}(x,y)}{v \Delta T(x,y)} = \frac {1 + \lambda q}{\lambda p} \ \ \ \ \ (23)$

To find the number of buses $N_{bus}$ in the entire city, we'll use a trick: we'll mentally replace each generalized corner corridor $\gamma$ with $\Delta x \Delta y$ simple corner cell paths lying within it.
image

Fig 4

For each such path, we will have:

$ N_{bus}^*(x,y) \approx \frac {N_{bus}(x,y)}{\Delta x \Delta y} = \frac {y N_{bus}(x,y)}{x (\Delta x)^2} \ \ \ \ \ (24) $

buses, out of those assigned to $\gamma$. Substituting into $(24)$ the expression for $\Delta x$ and $N_{bus}(x,y)$, we get:

$N_{bus}^*(x,y) \approx \frac {1 + \lambda q}{\lambda p} \cdot (3)^{- 2/3} y^{1/3}x^{1/3}(x + y)^{2/3} (L)^{- 4/3} \left ( \frac {p}{q} \right )^{2/3} \left ( \frac{\sigma}{v} \right )^{2/3} (\Delta l)^{10/3} \ \ \ \ \ (25)$

or after simplifications:

$N_{bus}^*(x,y) \approx = (3)^{- 2/3} \frac {1 + \lambda q}{\lambda p^{1/3}q^{2/3}} y^{1/3}x^{1/3}(x + y)^{2/3} \left ( \frac{\sigma}{v} \right )^{2/3} (L)^{- 4/3} (\Delta l)^{10/3} \ \ \ \ \ (26)$

The total number of buses in the city can now be found as:

$N_{bus} = 4 \sum_{x = 1}^{N} \sum_{y = 1}^{N} N_{bus}^*(x,y) \approx 4 \cdot (3)^{- 2/3} \frac {1 + \lambda q}{\lambda p^{1/3}q^{2/3}} \left ( \frac{\sigma}{v} \right )^{2/3} \int_{1}^{N} \int_{1}^{N} y^{1/3}x^{1/3}(x + y)^{2/3} (L)^{- 4/3} (\Delta l)^{10/3} dxdy \ \ \ \ \ (27)$

To calculate the integral in the last expression, we'll make a substitution $\alpha = x \Delta l/L$, $\beta = y \Delta l/L$ and take into account that $N = L/\Delta l$:

$\int_{1}^{N} \int_{1}^{N} y^{1/3}x^{1/3}(x + y)^{2/3} (L)^{- 4/3} (\Delta l)^{10/3} dxdy \approx L^2 \int_{0}^{1} \int_{0}^{1} \alpha ^{1/3} \beta^{1/3}(\alpha + \beta)^{2/3} d\alpha d\beta \ \ \ \ \ (28)$

The online calculator of double integrals gives an answer $\approx 0.61$. If we don't optimize too much and take $p=1/3$ and $q = 2/3$, then:

$N_{bus} \approx 2.21 \frac {1 + 2/3\ \lambda}{\lambda} L^2 \left ( \frac{\sigma}{v} \right )^{2/3} \ \ \ \ \ (29)$

The transport load $P$, which the city generates, as we know, is equal to $2/3 L^3 \sigma$, therefore the adjusted average bus load is:

$n_{pass}^* = \frac {P}{vN_{bus}} \approx 0.30 \frac {\lambda L}{1 + \lambda/2} \left ( \frac{\sigma}{v} \right )^{1/3} \ \ \ \ \ (30)$

3.4 Numerical estimates for almost real cities


Let's take $\lambda = 1/2$ again, then

$n_{pass}^*(\lambda = 1/2) \approx 0.11 L \left ( \frac{\sigma}{v} \right )^{1/3} \ \ \ \ \ (31)$

The maximum interval between buses will be inside the two largest corridors with x = y = N:

$max_{x,y}\Delta T (\lambda = 1/2) = L/3v \ \ \ \ \ (32)$

The width of the horizontal and vertical segments of generalized corridors depends on $x$, $y$ and does not depend on $\lambda$ at all. To get an idea of it, we will calculate it at values $x \Delta l = y \Delta l = L/2$, then

$\Delta r^*= (\Delta x \Delta l) = (\Delta y \Delta l) = (3)^{1/3} \frac {1}{(x\Delta l/L)^{1/3}((x +y)\Delta l/L)^{1/3}} \left ( \frac {2/3}{1/3} \right )^{1/3} \left ( \frac {v}{\sigma} \right )^{1/3} \approx 2.3 \left ( \frac {v}{\sigma} \right )^{1/3} \ \ \ \ \ (33)$

Hypothetical Square New York (London, Moscow):
Effective diameter $L \approx 28$ km,
Allowed speed $v = 0.8$ km/min
$\sigma \approx 33$ people/min sq km
$n_{pass}^* (\lambda = 1/2) \approx 0.11 \cdot 28 (33/0.8)^{1/3} \approx 10.6$ people ($21.2$ at peak).
$\Delta r^* \approx 2.3 \cdot (0.8/33)^{1/3} \approx 0.67$ km
$\Delta T (\lambda = 1/2) \leq 1/3\ \cdot 28/0.8 = 11.7$ min (on average $\sim 6$ min).

Hypothetical Square Berlin:
Effective diameter $L \approx 30$ km,
Allowed speed $v = 0.8$ km/min
$\sigma \approx 13$ people/min sq km
$n_{pass}^* (\lambda = 1/2) \approx 0.11 \cdot 30 (13/0.8)^{1/3} \approx 8.4$ people ($16.8$ at peak).
$\Delta r^* \approx 2.3 \cdot (0.8/13)^{1/3} \approx 0.91$ km
$\Delta T (\lambda = 1/2) \leq 1/3\ \cdot 30/0.8 = 12.5$ min (on average $\sim 6$ min).

Hypothetical Square Paris:
Effective diameter $L \approx 10$ km,
Allowed speed $v = 0.5$ km/min
$\sigma \approx 70$ people/min sq km
$n_{pass}^* (\lambda = 1/2) \approx 0.11 \cdot 10 (70/0.5)^{1/3} \approx 5.7$ people ($11.4$ at peak).
$\Delta r^* \approx 2.3 \cdot (0.5/70)^{1/3} \approx 0.45$ km
$\Delta T (\lambda = 1/2) \leq 1/3\ \cdot 10/0.5 = 6.7$ min (on average $\sim 3.5$ min).

Hypothetical Square Prague:
Effective diameter $L \approx 23$ km,
Allowed speed $v = 0.8$ km/min
$\sigma \approx 8.3$ people/min sq km
$n_{pass}^* (\lambda = 1/2) \approx 0.11 \cdot 23 (8.3/0.8)^{1/3} \approx 5.5$ people ($11$ at peak).
$\Delta r^* \approx 2.3 \cdot (0.8/8.3)^{1/3} \approx 1.1$ km
$\Delta T (\lambda = 1/2) \leq 1/3\ \cdot 23/0.8 = 9.6$ min (on average $\sim 5$ min).

Hypothetical standard square city of half a million population.
Population $P = 500K$ people,
Density $\rho = 5000$ people/sq km,
Effective diameter $L = 10$ km,
Allowed speed $v = 1$ km/min
$\sigma \approx 17$ people/min sq km
$n_{pass}^* (\lambda = 1/2) \approx 0.11 \cdot 10 (17/1)^{1/3} \approx 2.8$ people ($5.6$ at peak).
$\Delta r^* \approx 2.3 \cdot (1/17)^{1/3} \approx 0.90$ km
$\Delta T (\lambda = 1/2) \leq 1/3\ \cdot 10/0.5 = 6.7$ min (on average $\sim 3.5$ min).

Exercise: the reasoning in this chapter implicitly assumes that the generalized corner corridors of adaptive width can «cover» all «simple» corner corridors from $“Uppercorners”$ without overlaps. Find out whether there is actually a network of “Adaptivecorners” corner corridors of adaptive width that:

1) the dependence of $\Delta x$ and $\Delta y$ on $x$, $y$ is described by formula $(17)$ and $(7)$
2) each simple corner route from $“Uppercorners”$ as an area on the map lies within a single generalized corner route from $“Adaptivecorners”$.

If for some reason there is no “Adaptivecorners” network with the specified properties, think about how much and how you need to weaken requirements 1) and 2) to get a good enough equivalent?

4 Closer to Reality


4.1 Violation of Application Boundaries and the Need for Model Refinement


Until this point in all the joint taxi models we've built, we have assumed that the time costs associated with the imperfection of the route and waiting for a suitable car will be much greater than the time costs of acceleration/deceleration near stops and loading/unloading passengers at them. Are these assumptions justified? In fact, no!

Let's take our latest model with the “Adaptivecorners” network and analyze its results for a hypothetical Berlin. The model predicts that at $\lambda = 1/2$, the average number of passengers in the taxi bus will be approximately $8.5$. Since the graph of the expected number of passengers inside the bus has a triangular shape, “$\sim 8.5$ on average” means $\sim 17$ at maximum (at the corner point of the corridor). If so, on average the bus will make $\sim 17$ stops to pick up passengers and another $\sim 17$ to drop them off: a total of $\sim 34$ stops. Since our hypothetical cell-based Berlin has the form of a square with side $L \approx 30$ km, the average journey length in it is $2/3\ L = 20$ km. In this “average” journey, our bus passenger will participate in about half, that is, about $17$ stops, thus one taxi bus stop falls on $20/17 \approx 1.2$ kilometers of its path. Now let's remember (paragraph 3.2 part 1) that even for a transit bus, which travels only in a straight line and does not turn anywhere, in order not to be slower than a car more than $1 + 1/2$ times, it needs to make stops no more often than one on $\approx 2.5$ km.

It turns out that we neglected perhaps the main thing. Let's correct our calculations.

4.2 Back-of-the-Envelope Calculations


Due to their complexity, we won't conduct exact calculations here and will satisfy ourselves with almost exact estimates. Let's start by trying to get these estimates for our hypothetical Berlin, once we manage that, we can generalize them to all model cities.

The average journey that a traveler would have had to overcome if he used a private car is $2/3\ L = 20$ km. The average duration of travel by car would have been $2/3\ L/v = 20/0.8 = 25$ minutes. In the calculations of the previous chapter, we assumed that the average journey by taxi bus will be approximately $(1 + \lambda) = (1 + 1/2)$ times longer than the average journey by private car, therefore $(2\lambda /3)\ L/v = 12,5$ minutes is what a taxi bus passenger can spend on waiting for the bus and overcoming the excess length of the imperfect route. With an average load of $ n_{pass}^* = 8.5$ people, a passenger on average becomes a participant in about $17$ bus stops, so his time losses without considering the duration of stops and the bus slowing down at acceleration/deceleration sections are approximately

$T_{exra} = \frac {lambda L}{3vn_{pass}^*} \approx 0.74 \ \ \ \ \ (1)$ min/stop

Each stop requires two acceleration/deceleration sections: in the vicinity of the turn to the stop and in the vicinity of the stop itself, this leads to a delay of about $34$ seconds (paragraph 3.2 part 1). For each stop, approximately $1$ person boards or exits the bus, we will generously give them $8$ seconds for this (research shows that for a simple city bus this time is about $\sim 4$ seconds). It turns out that the previously unaccounted time losses amount to approximately $T_{stop} = 42$ seconds = $0.7$ min, which means that instead of $\lambda = 1/2$ we will actually be dealing with $\lambda = 1$. There is a simple way to get $\lambda$ back in place.

Let's note the following:

1) the loss of time waiting for the bus is proportional to their motion interval $\Delta T$;
2) the average adjusted number of passengers inside the cabin $n_{pass}^*$ is also proportional to $\Delta T$;
3) the average time losses of a passenger from each stop consist of $T_{stop}$ and the time of the bus moving sideways, which together are constant. The latter means that the total time losses of a bus taxi passenger from the stops experienced by them will be proportional to the number of the latter, therefore proportional to $n_{pass}^*$, therefore proportional to $\Delta T$.
4) it turns out that not only $T_{stop}$ but also $T_{exra}$ is a constant (does not depend on $\Delta T$)

The above statements show that the excess time taken by a bus taxi ride compared to a personal car ride is proportional to the bus motion interval $\Delta T$. To make $\lambda$ equal to $1/2$ again, we change the interval $\Delta T$ in all route corridors to

$\eta = \frac {T_{exra}}{T_{exra} + T_{stop}} = 0.74/1.44 = 0.51\ \ \ \ \ (2)$

times. The adjusted number of passengers $n_{pass}^*$ will also be multiplied by $\eta$ and will become equal to

$n_{pass}^{true} \approx \eta n_{pass}^* \approx 4.3 \ \ \ \ \ (3)$

passengers for the conditional Berlin. This result is much worse than what we had in the previous chapter, but there is one

4.3 Rabbit out of the hat: a pedestrian path section


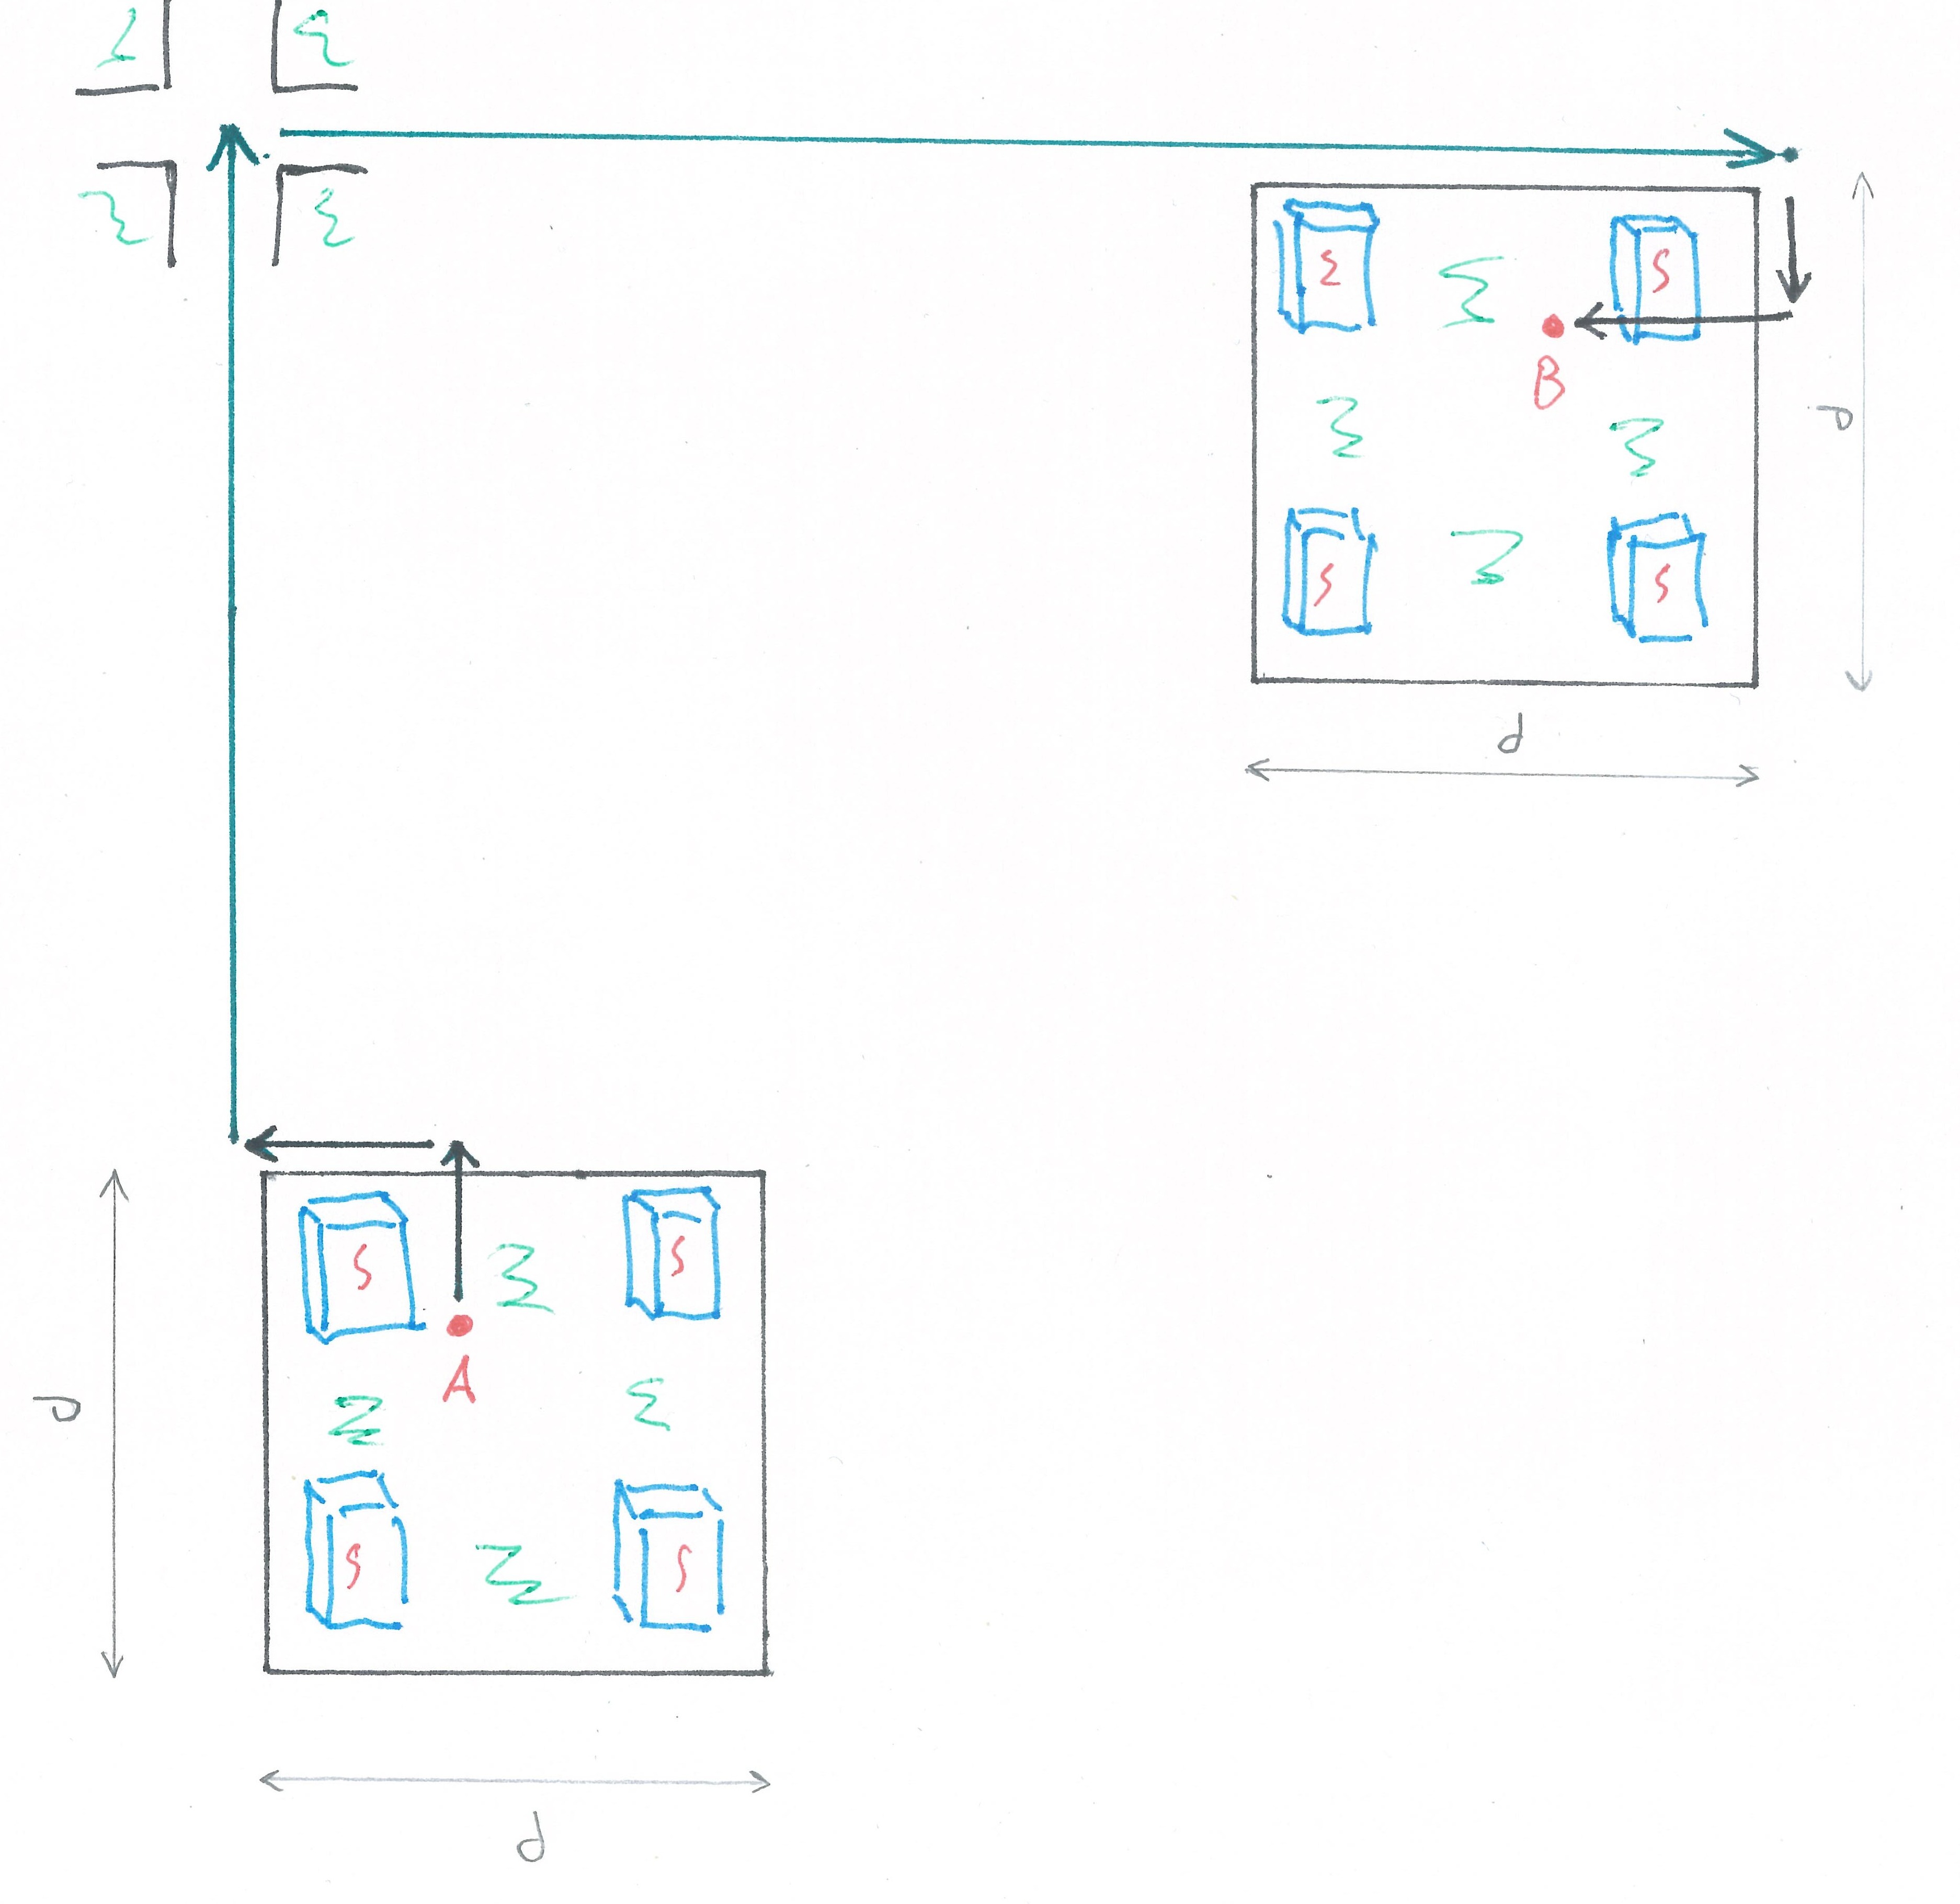
Since we have decided to bring the model closer to reality, we must take into account that the journey on public transport has two pedestrian paths inside the quarters (fig). The average time the traveler spends overcoming them, we denote as $T_{ped}$. The way to the parking place of the personal car and very slow driving inside the quarter also take time, for simplicity we will consider that it is also equal to $T_{ped}$.
image

Fig 5

The total length of pedestrian paths at the beginning and end of the journey is on average equal to the length of a city block. With a block length of $0.5$ km and an average pedestrian speed of $5$ km/h, the value of $T_{ped}$ equals $0.1$ hours, which is $6$ minutes.

With an adjustment for the pedestrian path, the average journey on a bus taxi will be allowed to exceed the travel time in a personal car by a time equal to:

$\lambda (2/3\ L/v + T_{ped}) \ \ \ \ \ (4)$

If $n_{pass}^{true}$ is the average number of passengers on the bus, then the average journey will be associated with $2 n_{pass}^{true}$ stops, at each of which the traveler will lose an average of $(T_{stop} + T_{extra})$ units of time. These considerations lead us to the balance equation:

$2 n_{pass}^{true} (T_{stop} + T_{extra}) = \lambda (2/3\ L/v + T_{ped}) = 2 n_{pass}^* T_{extra} + \lambda T_{ped} \ \ \ \ \ (5)$

from which

$n_{pass}^{true} = n_{pass}^* \frac {T_{extra}}{T_{stop} + T_{extra}} + 1/2\ \lambda\frac {T_{ped}}{T_{stop} + T_{extra}} \ \ \ \ \ (6) $

and

$\eta = n_{pass}^{true}/ n_{pass}^* \ \ \ \ \ (7) $

Accordingly for Berlin:

$ n_{pass}^{true} \approx 4.3 + 1/4\ \cdot 6/1.44 = 5.3$ people

$\eta = 5.3/8.4 = 0.63$

As you can see, we have an «extra passenger». Below are the recalculated results for all the model cities we used earlier.

Conditional square New York (London, Moscow):
effective diameter $L \approx 28$ km,
permissible speed $v = 0.8$ km/min
$n_{pass}^*\approx 10.6$ people.
$T_{extra} = 0.55$ min
$n_{pass}^{true} \approx 5.9$ people (peak $\sim 11.8$)
$\Delta T^{true} \leq 11.7 \cdot 5.9/10.6 = 6.5$ min.

Conditional square Berlin:
effective diameter $L \approx 30$ km,
permissible speed $v = 0.8$ km/min
$n_{pass}^* \approx 8.4$ people.
$T_{extra} = 0.74$ min
$n_{pass}^{true} \approx 5.3$ people (peak $\sim 10.6$)
$\Delta T^{true} \leq 12.5 \cdot 5.3/8.4 = 7.9$ min.

Conditional square Paris:
effective diameter $L \approx 10$ km,
permissible speed $v = 0.5$ km/min
$n_{pass}^* \approx 5.7$ people.
$T_{extra} = 0.58$ min
$n_{pass}^{true} \approx 3.75$ people (peak $\sim 7.5$)
$\Delta T^{true} \leq 6.7 \cdot 3.75/5.7 = 4.0$ min.

Conditional square Prague:
effective diameter $L \approx 23$ km,
permissible speed $v = 0.8$ km/min
$n_{pass}^* \approx 5.5$ people.
$T_{extra} = 0.87$ min
$n_{pass}^{true} \approx 4.0$ people (peak $\sim 8$)
$\Delta T^{true} \leq 9.6 \cdot 4/5.5 = 7.0$ min

Conditional standard square half-million city.
population $P = 500K$ people,
density $\rho = 5000$ people/sq km,
effective diameter $L = 10$ km,
permissible speed $v = 1$ km/min
$\sigma \approx 17$ people/min sq km
$n_{pass}^* \approx 2.8$ people.
$T_{extra} = 0.74$ min
$n_{pass}^{true} \approx 2.5$ people (peak $\sim 5$)
$\Delta T^{true} \leq 6.7 \cdot 2.5/2.8 = 6.0$ min

As you can see, the true number of passengers is not a gold mine, but it's something. Can we improve the result? Let it remain our little intrigue (🎶).

5 For you


To the little Sleeping Dragon,
The young Igniter of Hearts (🎶),
I was lucky to see your charm — They are beautiful.
I will miss them (🎶).
.
.
.
.
Sergey Kovalenko
magnolia@bk.ru
(It was a wonderful)
spring of 2023.

Link to Part 1: «Preliminary Analysis» (ру / eng )
Link to Part 2: «Experiments on a Torus» (ру / eng )
Link to Part 3: «Practically Significant Solutions» (ру / eng )
Link to «Summary» (ру / eng )
Теги:
Хабы:
Всего голосов 4: ↑3 и ↓1+2
Комментарии4

Публикации