The Time Travel Debugging (TTD) preview in Visual Studio Enterprise 2019 provides the ability to record a Web app running on a Azure Virtual Machine (VM) and then accurately reconstruct and replay the execution path. TTD integrates with our Snapshot Debugger offering and allows you to rewind and replay each line of code however many times you want, helping you isolate and identify problems that might only occur in production environments.
This article in blog
The most effective type of debugging often occurs in what we call the “inner loop”. While you’re in the act of reviewing and debugging code locally, before you’ve pushed to version control. The problems we encounter during inner loop development are usually easier to understand and diagnose because they are accessible and repeatable.
Today, we’re excited to announce the release of the Time Travel Debugging (TTD) in Visual Studio Enterprise. With TTD, we are giving you the power to record code executed in production and replay the execution path inside Visual Studio. TTD also gives you the ability to move forward and backwards in time as if you were performing “inner loop” debugging locally. You also get access to important debugging features like locals and the call stack.
Today’s debuggers typically allow you to stop at a specific breakpoint by halting the entire process and then only move forward. Even with a more advanced debugging tool like IntelliTrace, you record events and data at discrete moments in time. TTD has a significant advantage over snapshots, logging or crash dump files, as these methods are generally missing the exact details of the execution path that led up to the final failure or bug.
What is the Time Travel Debugging?
Time Travel Debugging (TTD) is a reverse debugging solution that allows you to record the execution of code in an app or process and replay it both forwards and backwards. TTD improves debugging since you can go back in time to better understand the conditions that lead up to a specific bug. Additionally, you can replay it multiple times to understand how best to fix the problem. TTD technology was recently introduced in a preview version of WinDbg for native code scenarios.
We have extended the Snapshot Debugger with TTD to allow you to record your applications as it executes. That recording can then be played back in Visual Studio 2019 Enterprise where you can rewind and replay each line of code as many times as you want. TTD records on the thread that matches the snappoint conditions and will generally run until the end of the method. If there is an “await” after the snappoint but before the end of the method, we will stop recording where the await occurs. This feature will be in preview for the release of Visual Studio 2019 with a go live license. We plan to add more TTD scenarios in future updates.
Getting started with TTD
The Time Travel Debugging preview can be enabled in the latest version of Visual Studio Enterprise 2019 for Azure Virtual Machines on the Windows OS running ASP.NET (4.8+).
After installing the latest version of Visual Studio Enterprise, complete the following steps:
1. Open the project you would like to Time Travel Debug – ensure that you have the same version of source code that is published to your Azure Virtual Machine.
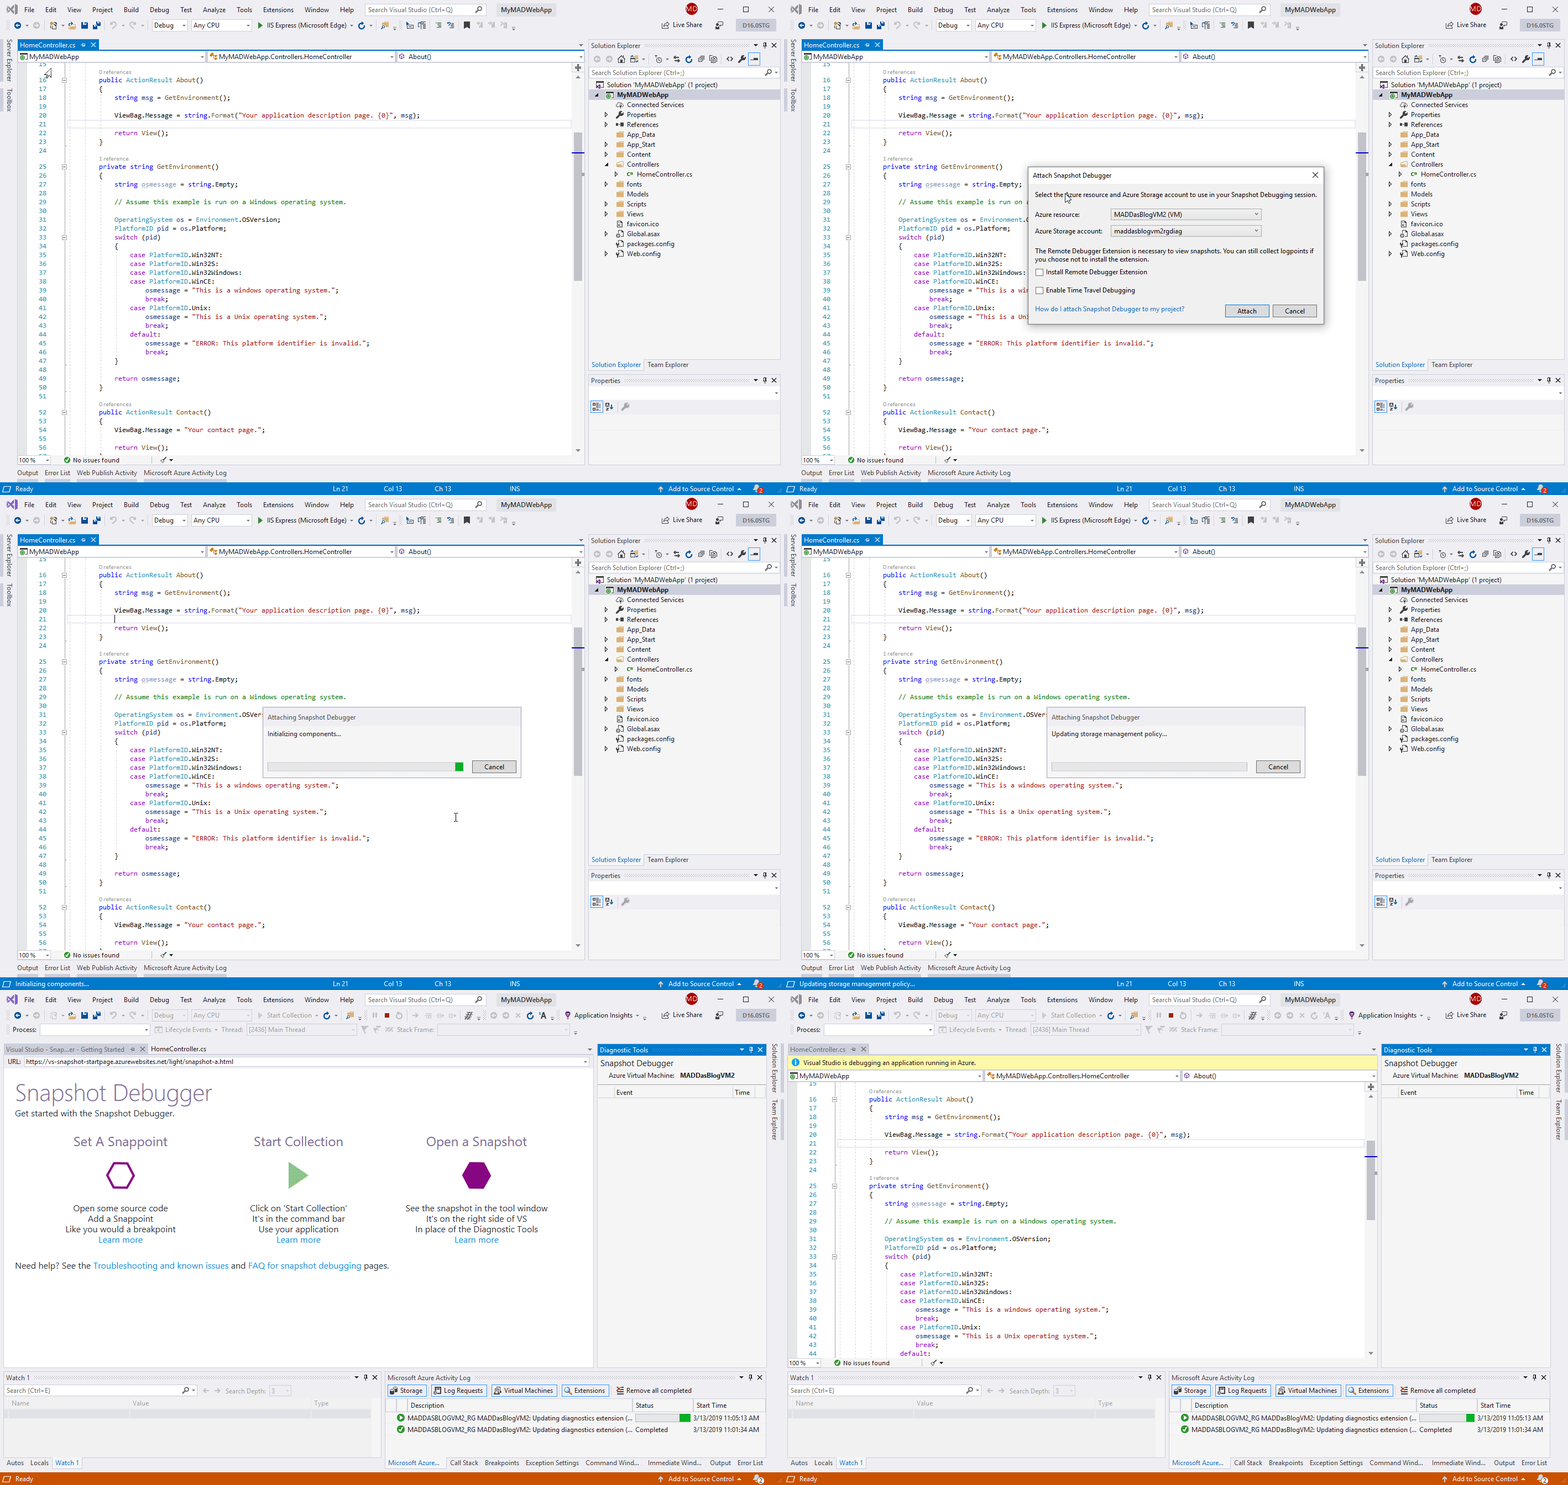
2. Choose Debug > Attach Snapshot Debugger and select the Azure Virtual Machine your project is deployed to along with an Azure storage account. You will be required to install the Snapshot Debugger site extension the first time an attach is attempted.
3. Select the Time Travel Debugging option and then click Attach. Once Visual Studio is in Snapshot Debugger mode it will be capable of recording using TTD.
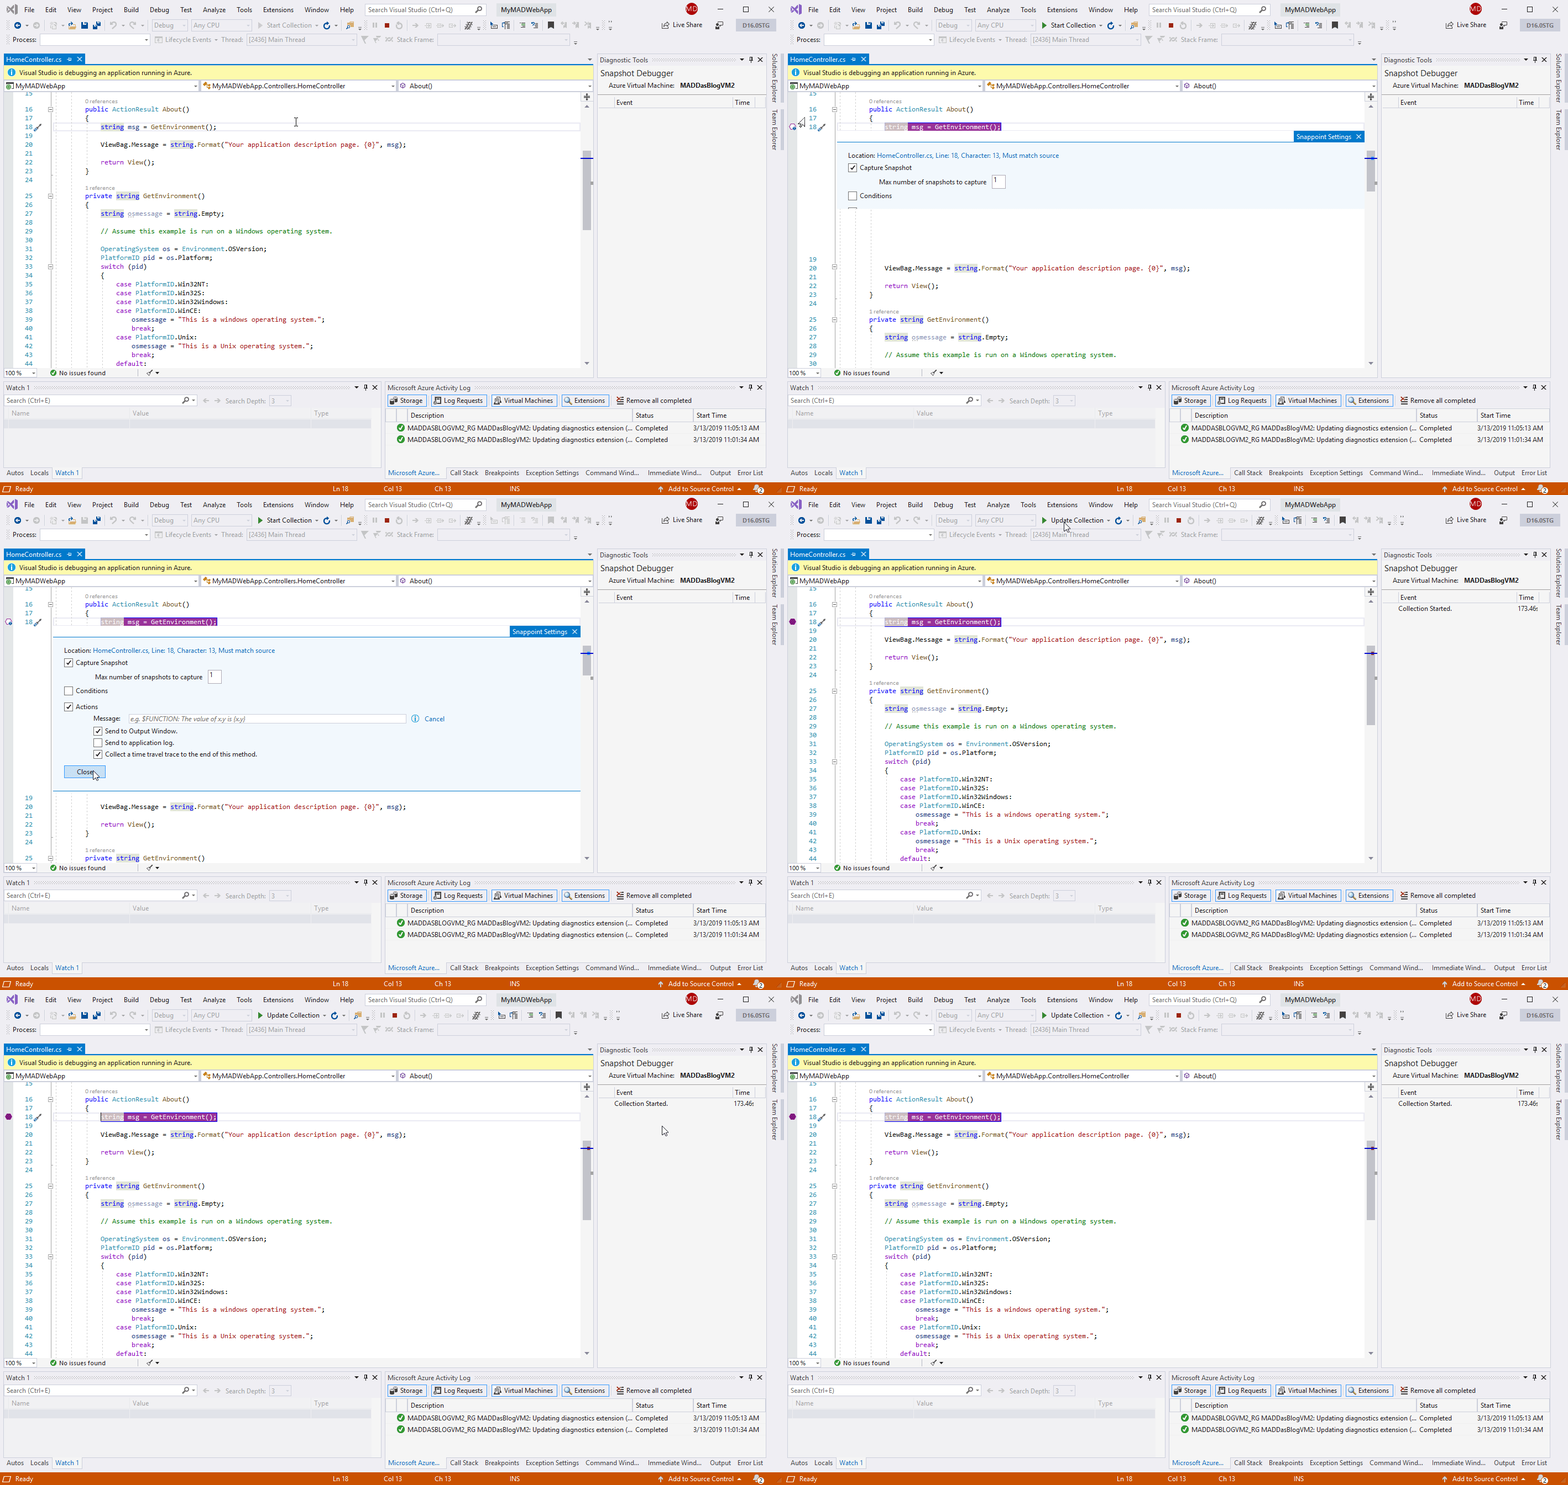
4. Create a snappoint and configure it to enable time travel debugging. Click Start\Update Collection.
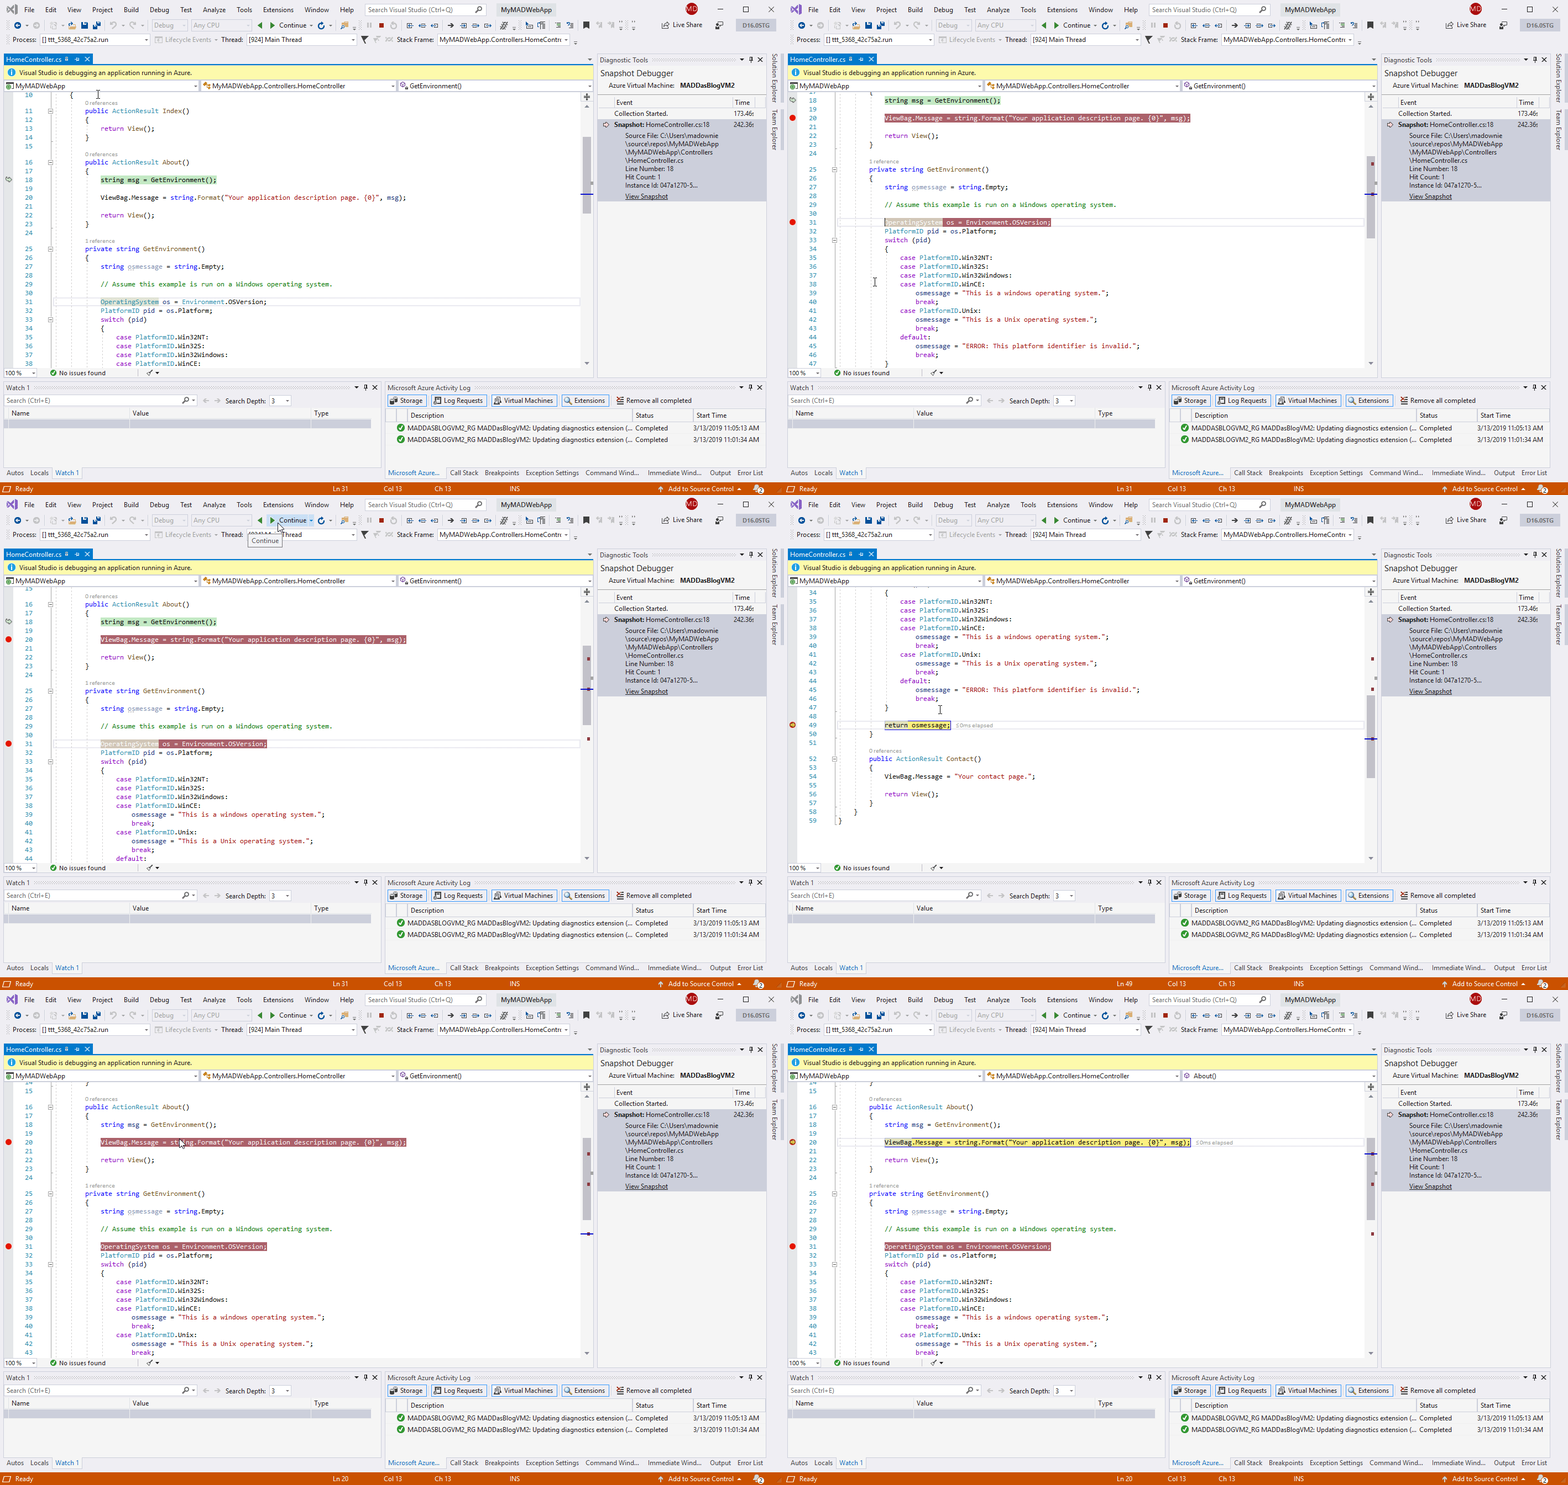
5. Once your Snapshot has been collected click on View Snapshot and you can use the command bar to step forwards and backwards within the recorded method.
TTD preview limitations
During the initial preview stage of TTD we will be supporting AMD64 Web apps running on a Azure Virtual Machine (VM). We expect that recording will add significant overhead to your running process, slowing it down based on process size and the number of active threads. We also anticipate a degraded debugging experiences in some of the following scenarios: –
- During a GC compacting phase.
- Stepping through an optimized method e.g. when you step into a method that does not contain a snappoint.
- If your application internally loads or unloads app domains.
- Recording only occurs on the thread that was triggered by the snappoint, code that subsequently impacts alternate threads will also be degraded.
Please Note: we will also not record the async causality chains.
During preview testing we found that the TTD file sizes ranged from several hundred megabytes up to several gigabytes depending on how long your session lasts and how long the web app runs. However, files created by TTD will be cleaned up once the Snapshot Debugger session ends, and an app pool recycle is initiated. For our preview release we also recommend using a VM with a minimum of 8GB RAM.
Try out TTD now!
We are incredibly excited about how this preview feature can help enhance your debugging experiences in Azure, but this is just the beginning. Our team continues to design and build additional TTD capabilities that we plan to add in upcoming Visual Studio releases.
We are counting on your feedback via our Developer Community and the Feedback Hub, you can help us prioritize what improvements to make because we genuinely value all the responses you provide.

Mark Downie
Program Manager, Visual Studio Production Diagnostics


