
Хабр Курсы для всех
РЕКЛАМА
Практикум, Хекслет, SkyPro, авторские курсы — собрали всех и попросили скидки. Осталось выбрать!

анализатор работает на частоте в 30-100 GHz ????
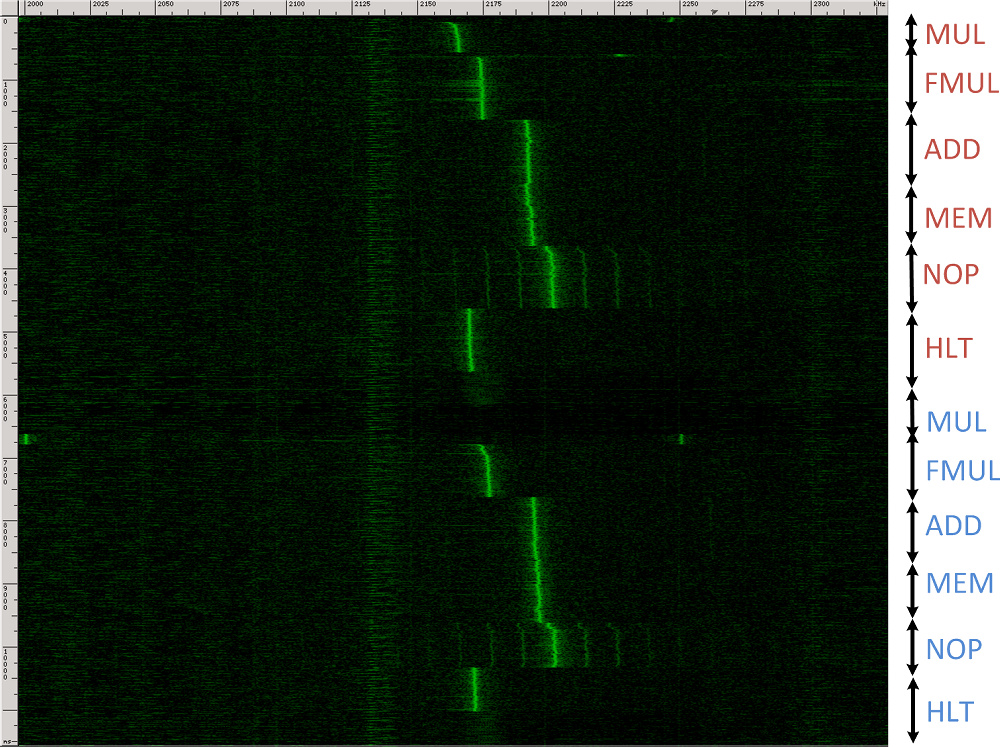
A good way to visualize the signal is as a spectrogram, which plots the measured power as a function of time and frequency. For example, in the following spectrogram, time runs vertically (spanning 10 seconds) and frequency runs horizontally (spanning 0-2.3 MHz). During this time, the CPU performed loops of different operations (multiplications, additions, memory accesses, etc.). One can easily discern when the CPU is conducting each operation, due to the different spectral signatures.
We have disclosed our attack to GnuPG developers under CVE-2013-4576, suggested suitable countermeasures, and worked with the developers to test them. New versions of GnuPG 1.x and of libgcrypt (which underlies GnuPG 2.x), containing these countermeasures and resistant to our current key-extraction attack, were released concurrently with the first public posting of these results. Some of the effects we found (including RSA key distinguishability) remain present.
Потрогай, чтобы взломать