Do you need to produce satellite interferometry results for your work or study? Or should you find the way to process terabytes of radar data on your common laptop? Maybe you aren't confident about the installation and usage of the required software. Fortunately, there is the next generation of satellite interferometry products available for you. Beginners can build the results easily and advanced users might work on huge datasets. Open Source software PyGMTSAR is available on GitHub for developers and on DockerHub for advanced users and on Google Colab for everyone. This is the cloud-ready product, and it works the same as do you run it locally on your old laptop as on powerful cloud servers.

About
PyGMTSAR provides an interactive processing environment with annotations and quality plots and progress indicators for the complete processing pipeline. There is no software installation hassle or complex steps to produce the results, but just live annotated examples in your web browser are available with a single click. When it already works, you are free to change the source datasets and processing parameters and see all the results for your own tasks.
In case it amazed you how all of that is possible, visit the project documentation page https://mobigroup.github.io/gmtsar/ Here are lots of modern algorithms and programming techniques combined to make it really easy to use. Or just continue to read to try it immediately. Software invented to make our work more productive and it should not distract us from our work and PyGMTSAR follows the way.
The Story Behind Product
I’m radio physics and I have master’s degree and awards for research in fundamental and application interferometry and holography and science and industrial software developer with 20+ years experience. Some years ago I had the time to try satellite interferometry for a slight task. And it really frustrated me how hard satellite interferometry processing is using existing software! I found all the software incredibly overcomplicated and counter-intuitive. Anyway, Open Source GMTSAR satellite interferometry package was the best one for me for lots of reasons. I had explained some of my ideas to GMTSAR developers team but they were not interested in redesigning the software completely and rewrite all the codes. Well, that’s so hard and possibly I could not highlight all the advantages of doing it. Alright, there is just one way to prove all my ideas and so I have been writing a new one satellite interferometry product. When it is possible, PyGMTSAR uses some of the GMTSAR binary tools under the hood, wrapping all of them for interactive and easy use. For now the new software is user-friendly, and it works faster and allows to process huge datasets on a common hardware.
How To Start with PyGMTSAR
In case you are not a software developer or engineer, that is not your work to install and configure software products. PyGMTSAR does not require any installation and you are free to start your work right now. And that is more than a cloud only software because it is usable on your computer offline too. Below, the two ways explained how to run PyGMTSAR in a single click in your web browser online and how to download and run it on your computer.
One-click Live Examples Online
The fastest way to start your satellite interferometry journey is to click on the links below to open the full functional InSAR pipeline on your web browser page. Every example is complete and self documented and provides rich plots and maps. Use the examples as templates for your own tasks, replacing the used radar scenes and processing parameters following your needs.
 Live example "ASF Downloading 2017 Iran–Iraq Earthquake vs GMTSAR GAMMA SNAP Co-Seismic Interferogram" downloads Sentinel-1 Scenes from Alaska Satellite Facility (ASF) and compares the interferogram and LOS displacement to GMTSAR, SNAP and GAMMA Software.

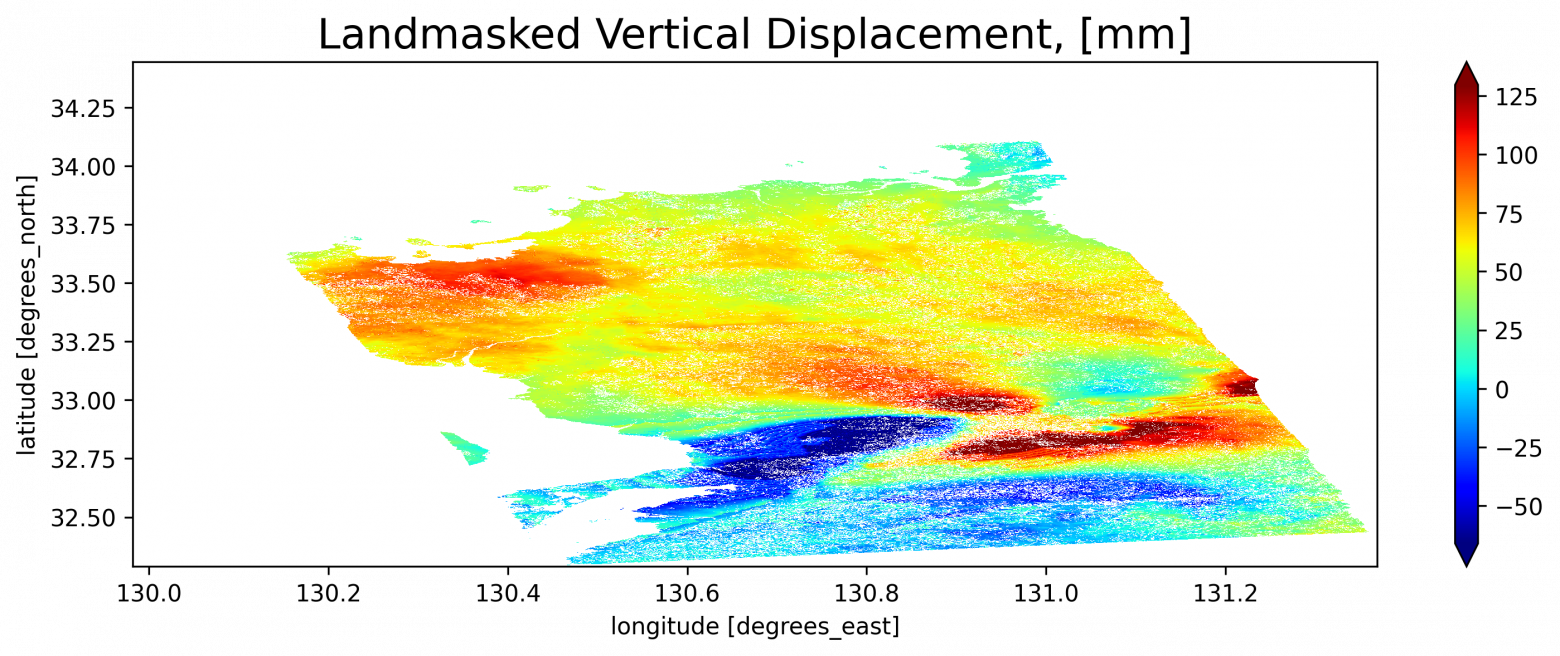
Live example "S1A 2016 Kumamoto Earthquake Co-Seismic Interferogram vs ESA Sentinel 1 Toolbox on Alaska Satellite Facility" is a single sub-swath processing with landmask applied to interferogram, unwrapped phase, and LOS, east-west, vertical displacement results.


Live example "S1AB 2021 Crete Earthquake Co-Seismic Interferogram vs Centre of EO Research & Satellite Remote Sensing, Greece Report" is a single cropped sub-swath processing with landmask applied to interferogram, unwrapped phase, and LOS, east-west, vertical displacement results.


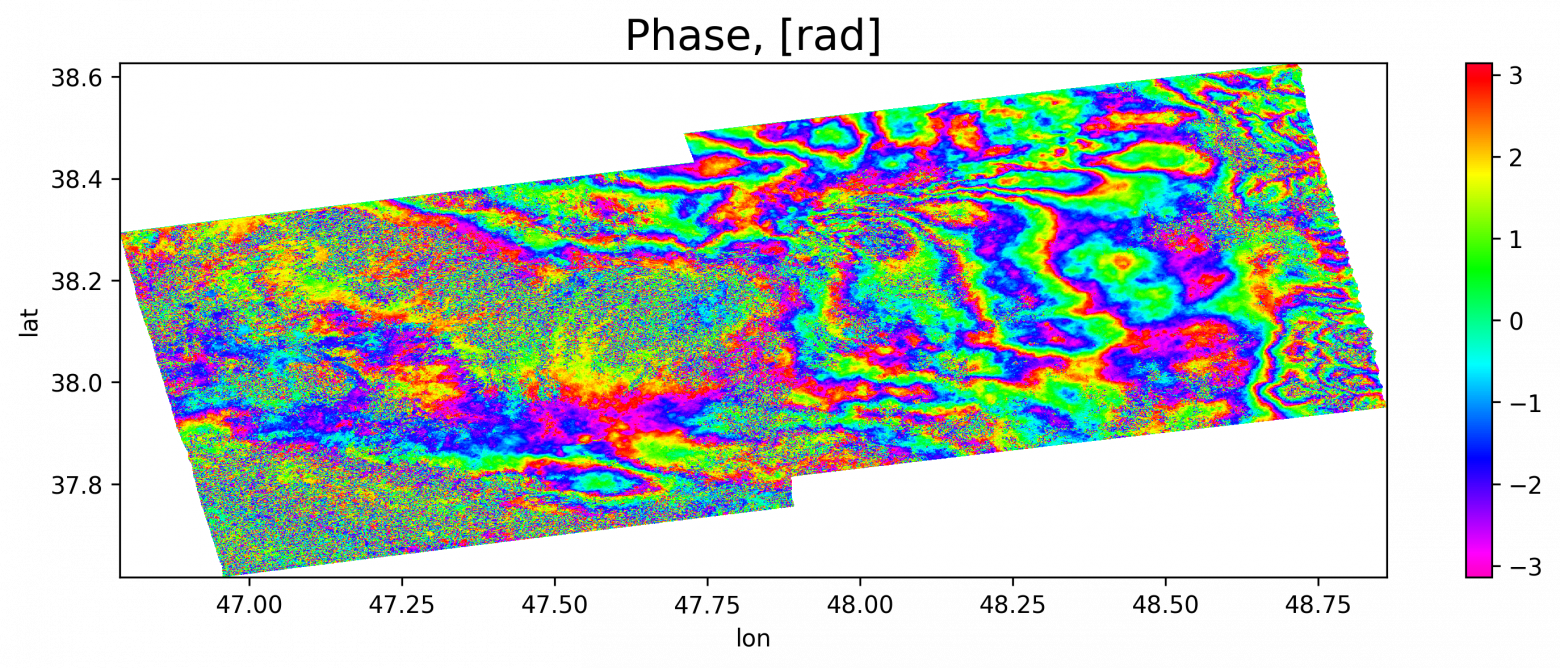
Live example "GMTSAR example dataset S1A_Stack_CPGF_T173" illustrates SBAS analyse and detrending approach to remove atmospheric noise to produce much better results.

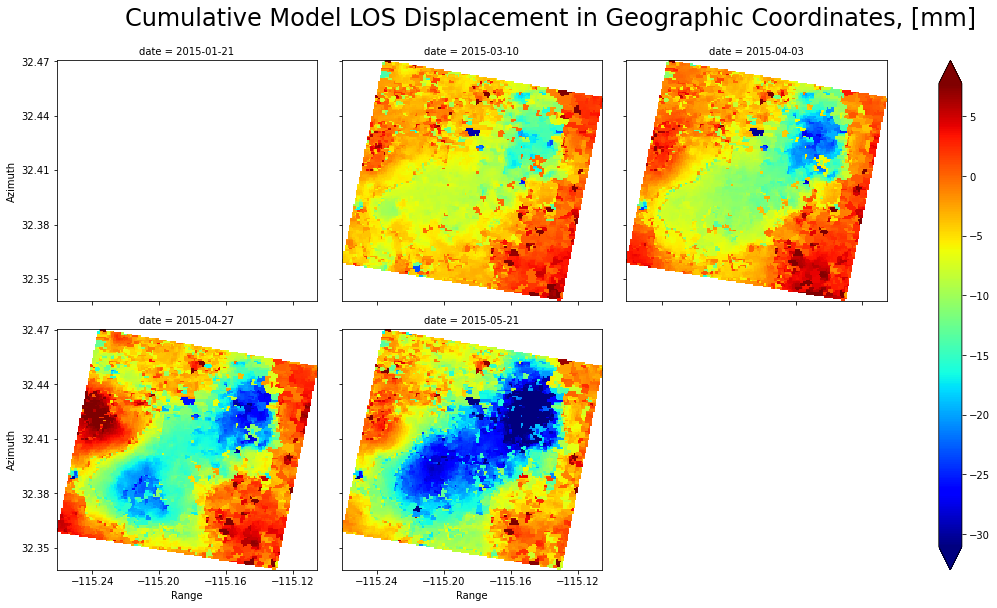
Live example "ASF Downloading 2020 Ardabil, Iran Earthquake Co-Seismic Interferogram and LOS Displacement" downloads Sentinel-1 Scenes from Alaska Satellite Facility (ASF) to crop the area and merge sub-swaths and detrend results.

Live Examples for Offline Usage
PyGMTSAR on your computer requires only two things: download and run it using Docker Desktop tool like. And maybe you need to install Docker Desktop first if you do not have it already, this step is easy and I explain it below.
Install Docker Desktop
Docker Desktop is a tool to run prepared software packages on different operating systems. It supports Windows, Linux, MacOS Intel & Apple Silicon systems. For other OSes there is Docker Engine tool too, although it is more complicated to use.
By this way download and install Docker Desktop for your computer’s operation system following the instructions below if you need step-by-step help for the process:
Register on DockerHub (optional)
There are multiple ways to download the prepacked software images for Docker Desktop. The required console commands for users familiar with the command console provided on DockerHub software pages and user interface for it available in Docker Desktop. Click “Sign in” at the top right corner of the application window to register and login to DockerHub:

DockerHub registration is available on the page opened by the button click or by the direct link: Create a Docker Account.
Configure Docker Desktop
Click gear icon at the top right corner of Docker Desktop window to open the settings page and select "Resources" section:
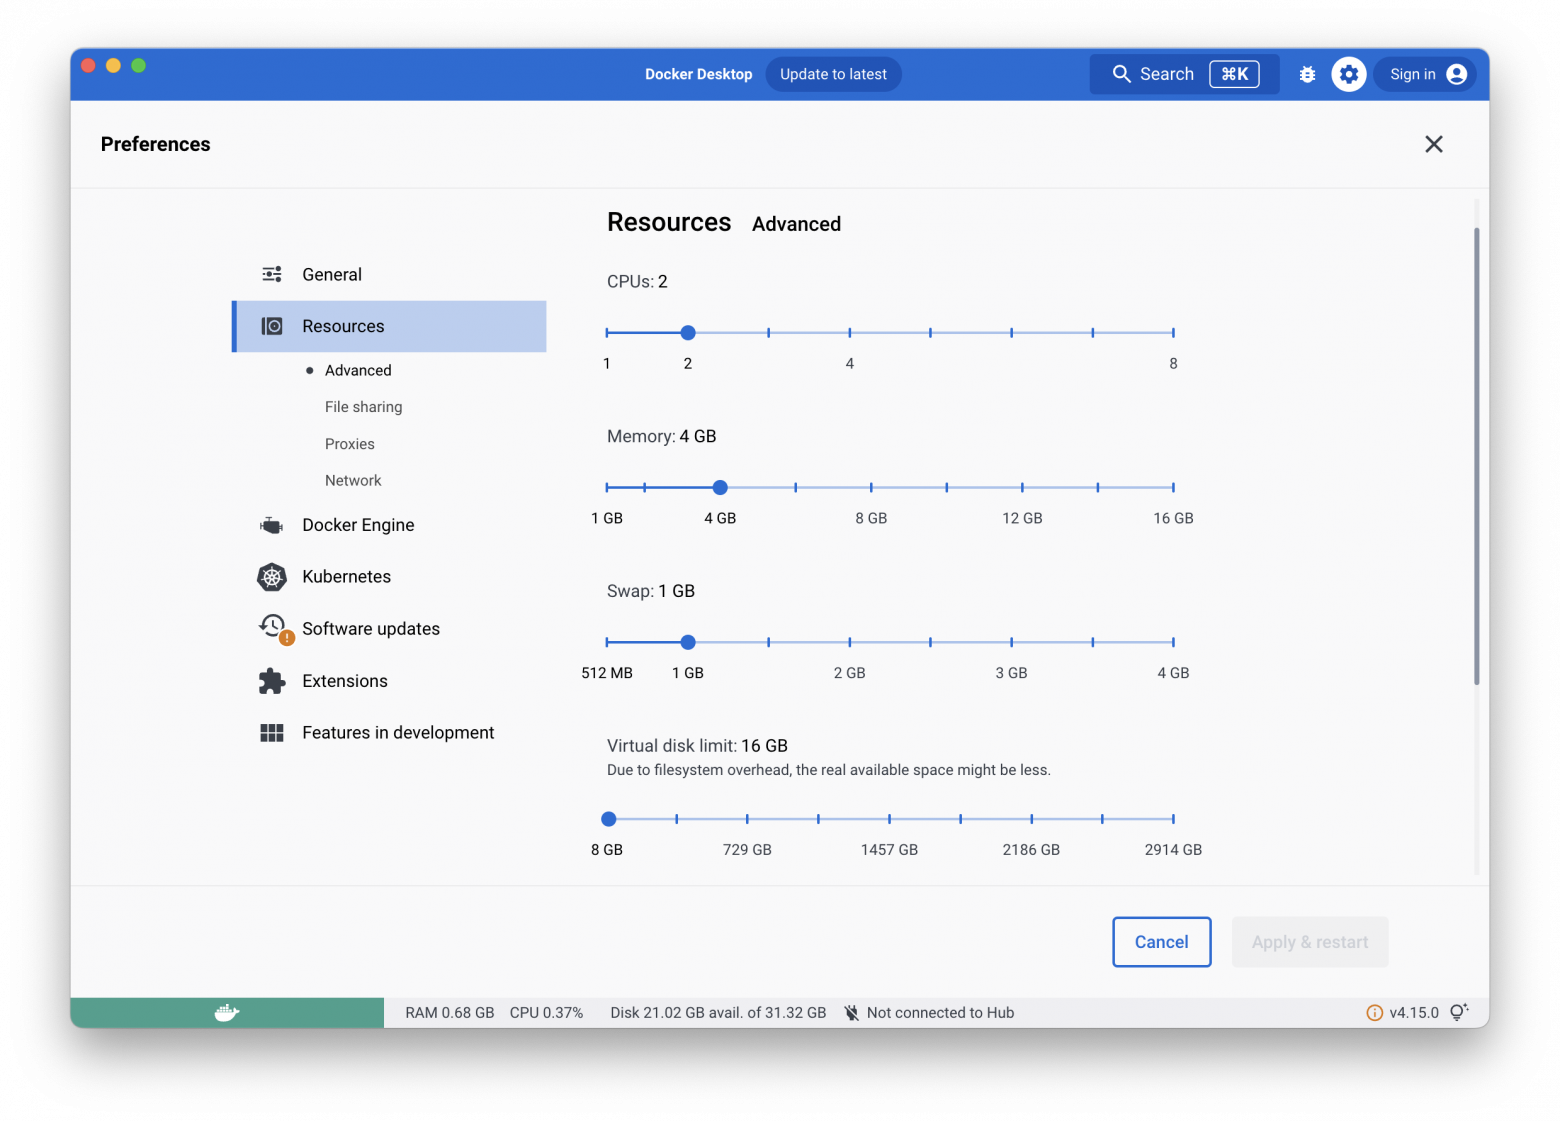
The settings above are enough for S1A_Stack_CPGF_T173.ipynb notebook example from "mobigroup/pygmtsar" image "for everyone": 2 CPU cores, 4 GB RAM, 1 GB swap and 16 GB virtual disk. To run all the notebooks sequentially, set the virtual disk limit to 200 GB. Yes, satellite interferometry processing is a lot of space consuming!

To launch "mobigroup/pygmtsar" required 4 CPU cores, 16 GB RAM, 1 GB swap and 500 GB virtual disk. It produces 34 interferograms for 3 GB size each and corresponding the same size correlation files and performs denoising and SBAS analysis on them. This challenging task completes easily on the both my Apple Silicon iMac 16 GB RAM and Air 24 GB RAM (that is ok to allow Docker Desktop to use all the available RAM).

Download PyGMTSAR
As soon as you have completed the registration and logged in the application search box is functional to find “pygmtsar” on “Images“ tab:
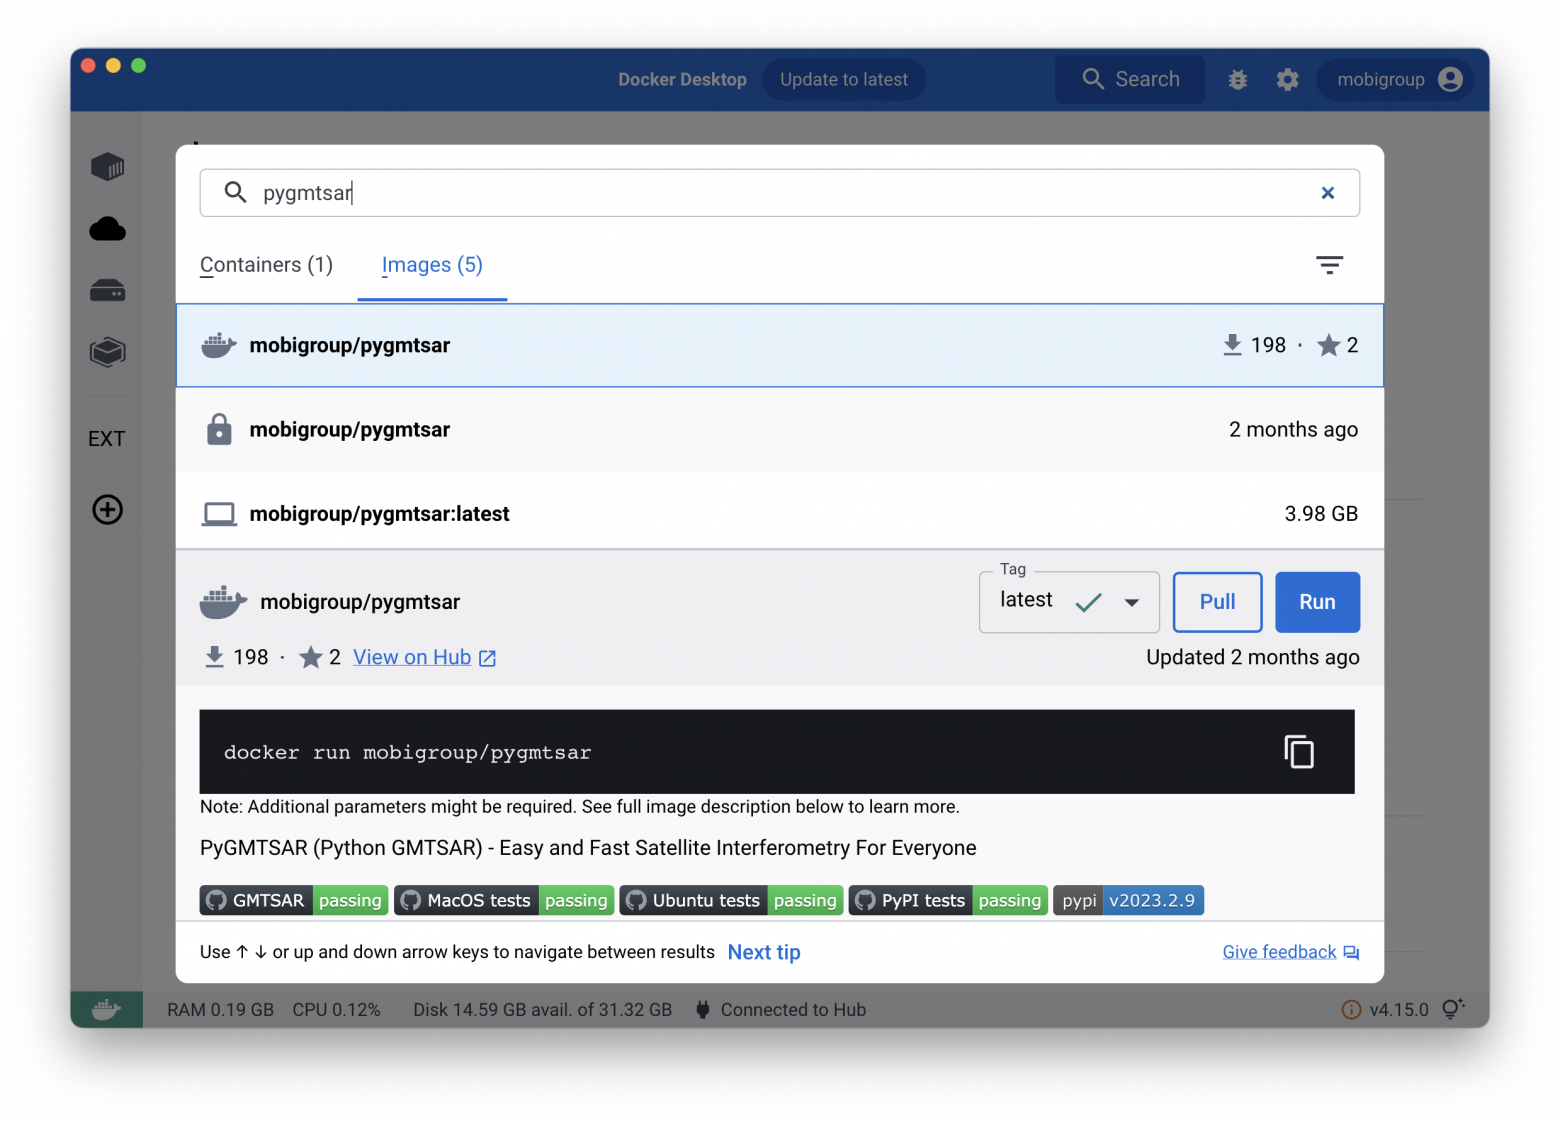
Pay attention here mobigroup/pygmtsar is a basic PyGMTSAR 1GB image for everyone and mobigroup/pygmtsar-large is a large 50 GB image for experts. When you have selected the right image for you, click “Pull” button on it to download PyGMTSAR to your computer.
For reference, these are the direct links to PyGMTSAR packed images for Docker Desktop on DockerHub:
- PyGMTSAR (Python GMTSAR) — Easy and Fast Satellite Interferometry For Everyone,
- PyGMTSAR (Python GMTSAR) — Easy and Fast Satellite Interferometry For Experts.
And original GMTSAR InSAR package available as Docker image too: - GMTSAR InSAR processing system based on GMT.
Run PyGMTSAR
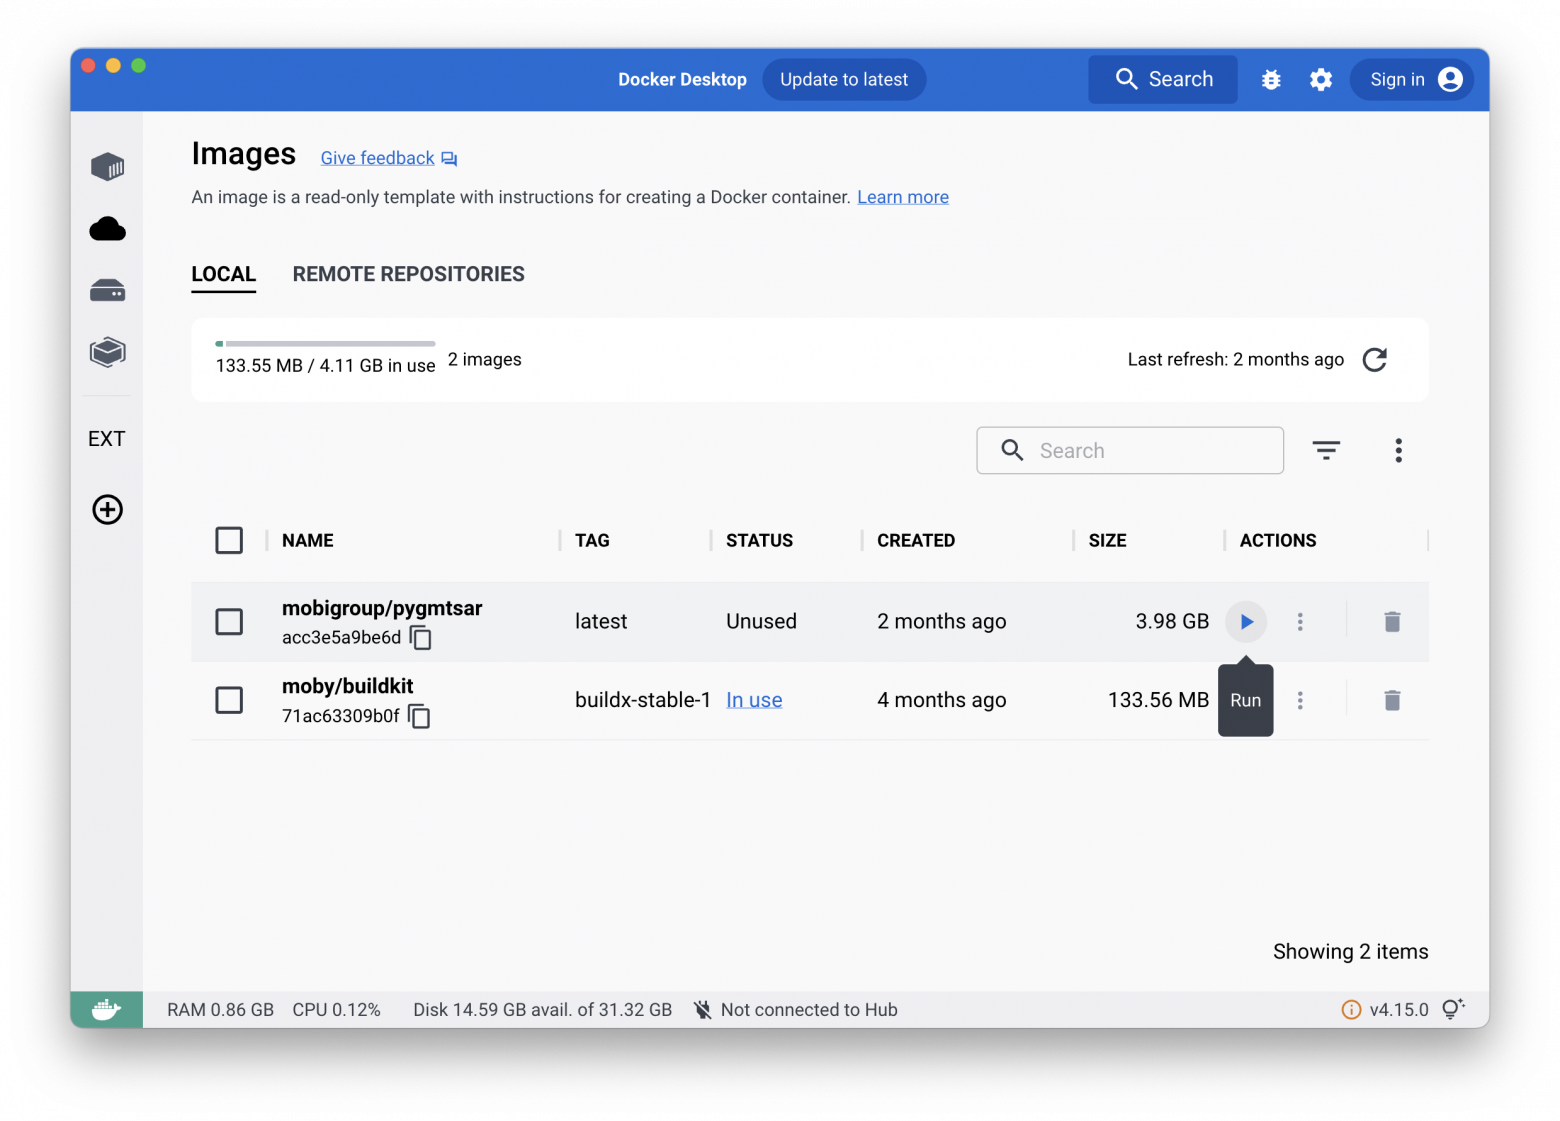
Docker Desktop "Images" section lists all the packed software images and allows to manage them. Click the triangle button to run the downloaded PyGMTSAR image, as shown below.
PyGMTSAR interacts with you via a web page in your wed browser using the network port 8888, define it as on the screen below and optionally fill the name field like to "PyGMTSAR":

The "Run" button on the form above runs the software on your computer:
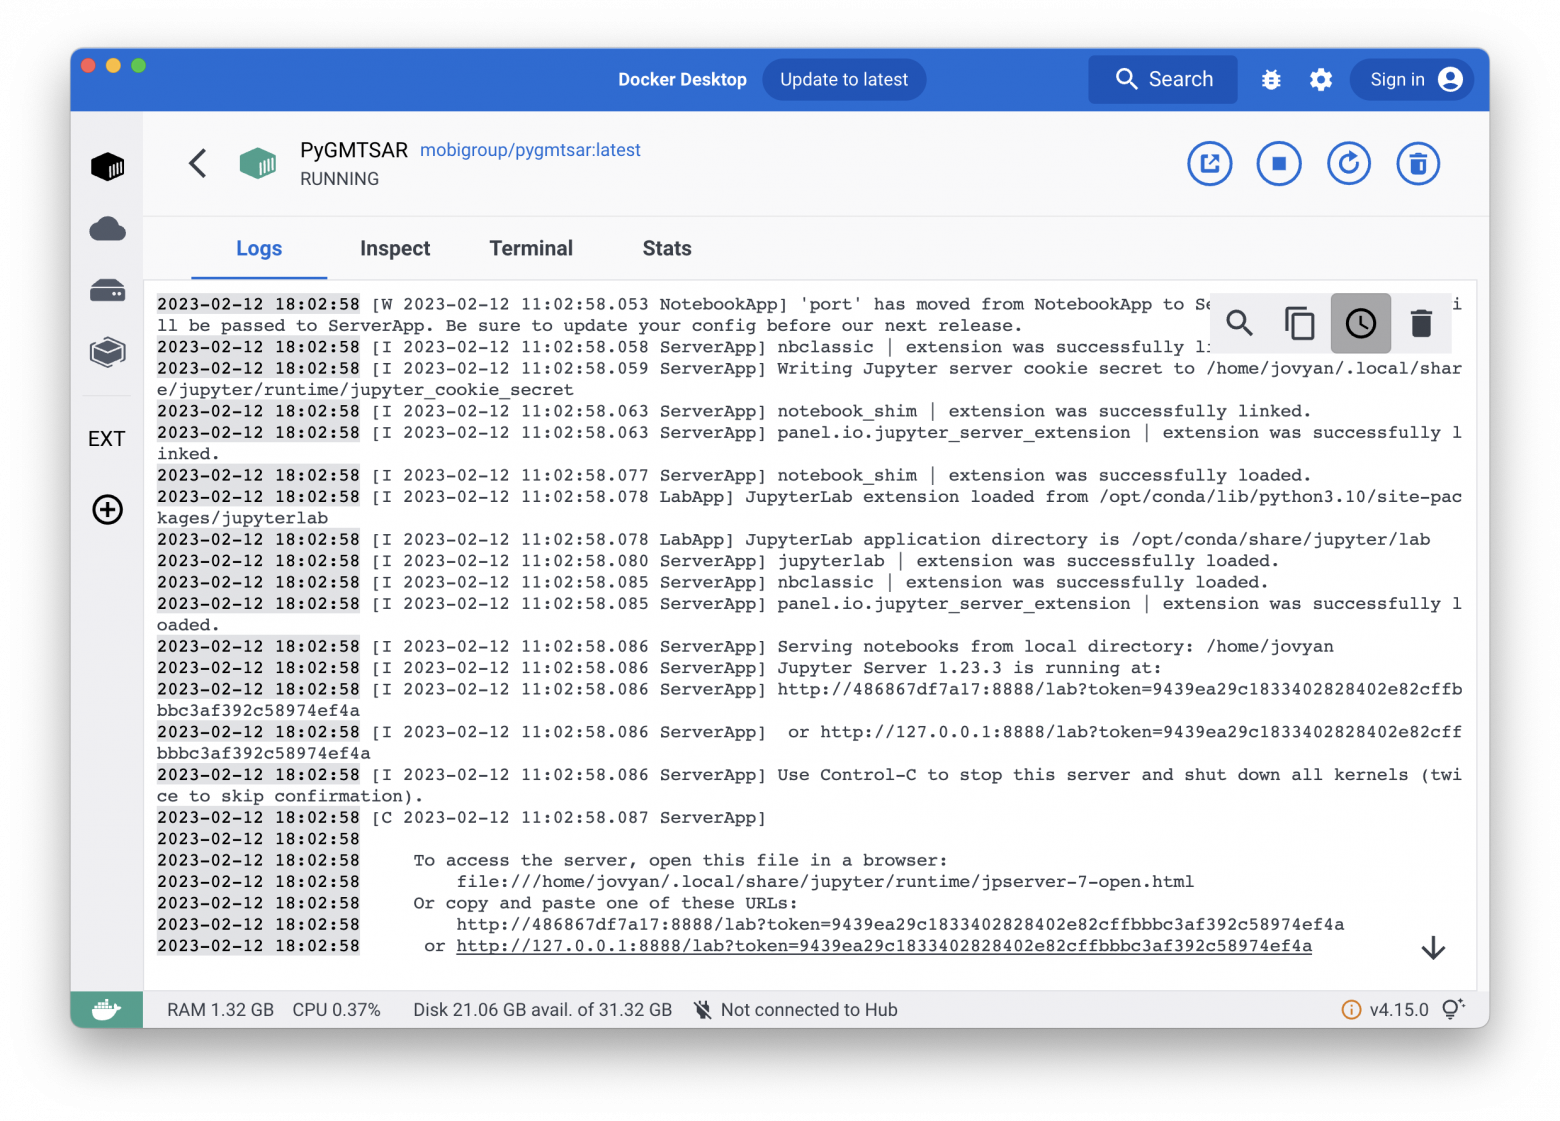
Click on the bottom link on the "Logs" page above to go on your web browser page and start work:
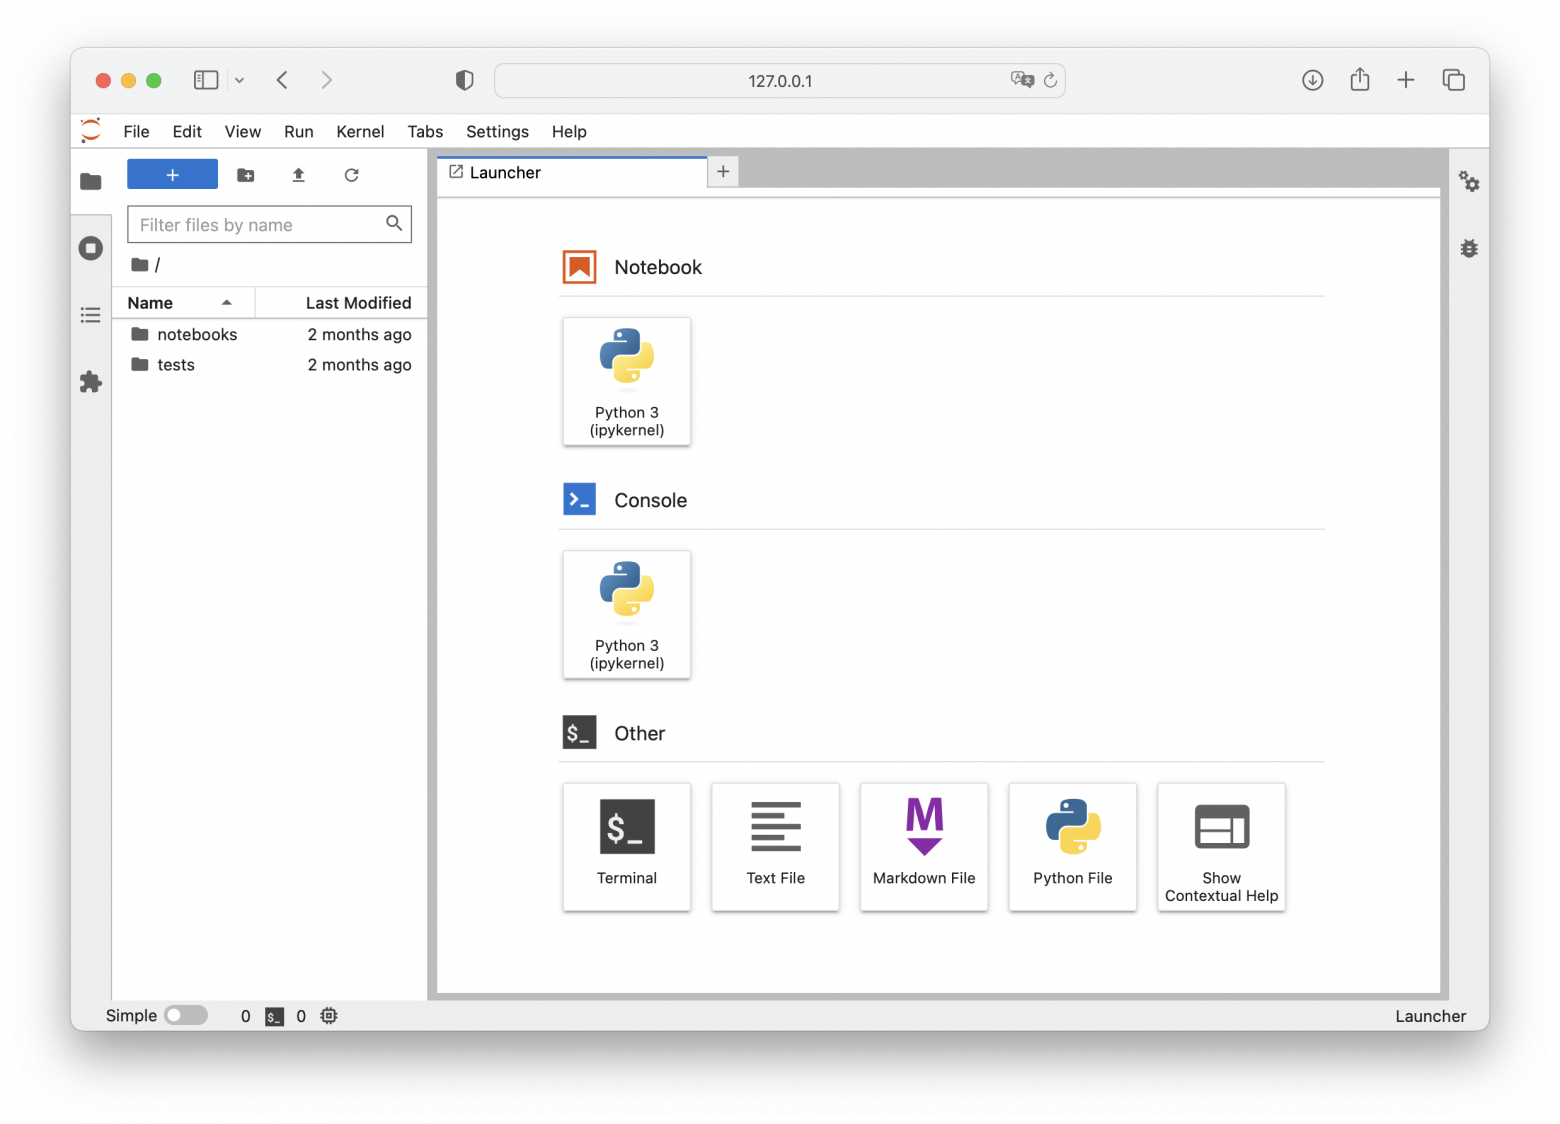
This interface provides an interactive work environment where the left panel lists all the files and directories and the right panel shows interactive editor, viewer, console, and more. The "notebooks" directory comprises interactive Jupyter notebook examples:

Also, the "tests" directory includes command-line Python script examples for someones who prefers console scripts. The script work not interactively in batch mode and generates the same plots as the interactive examples, see the archived outputs on PyGMTSAR GitHub Actions page.
Click on an example in the left panel to open it:

Scroll the example up and down to read the text and see the maps:

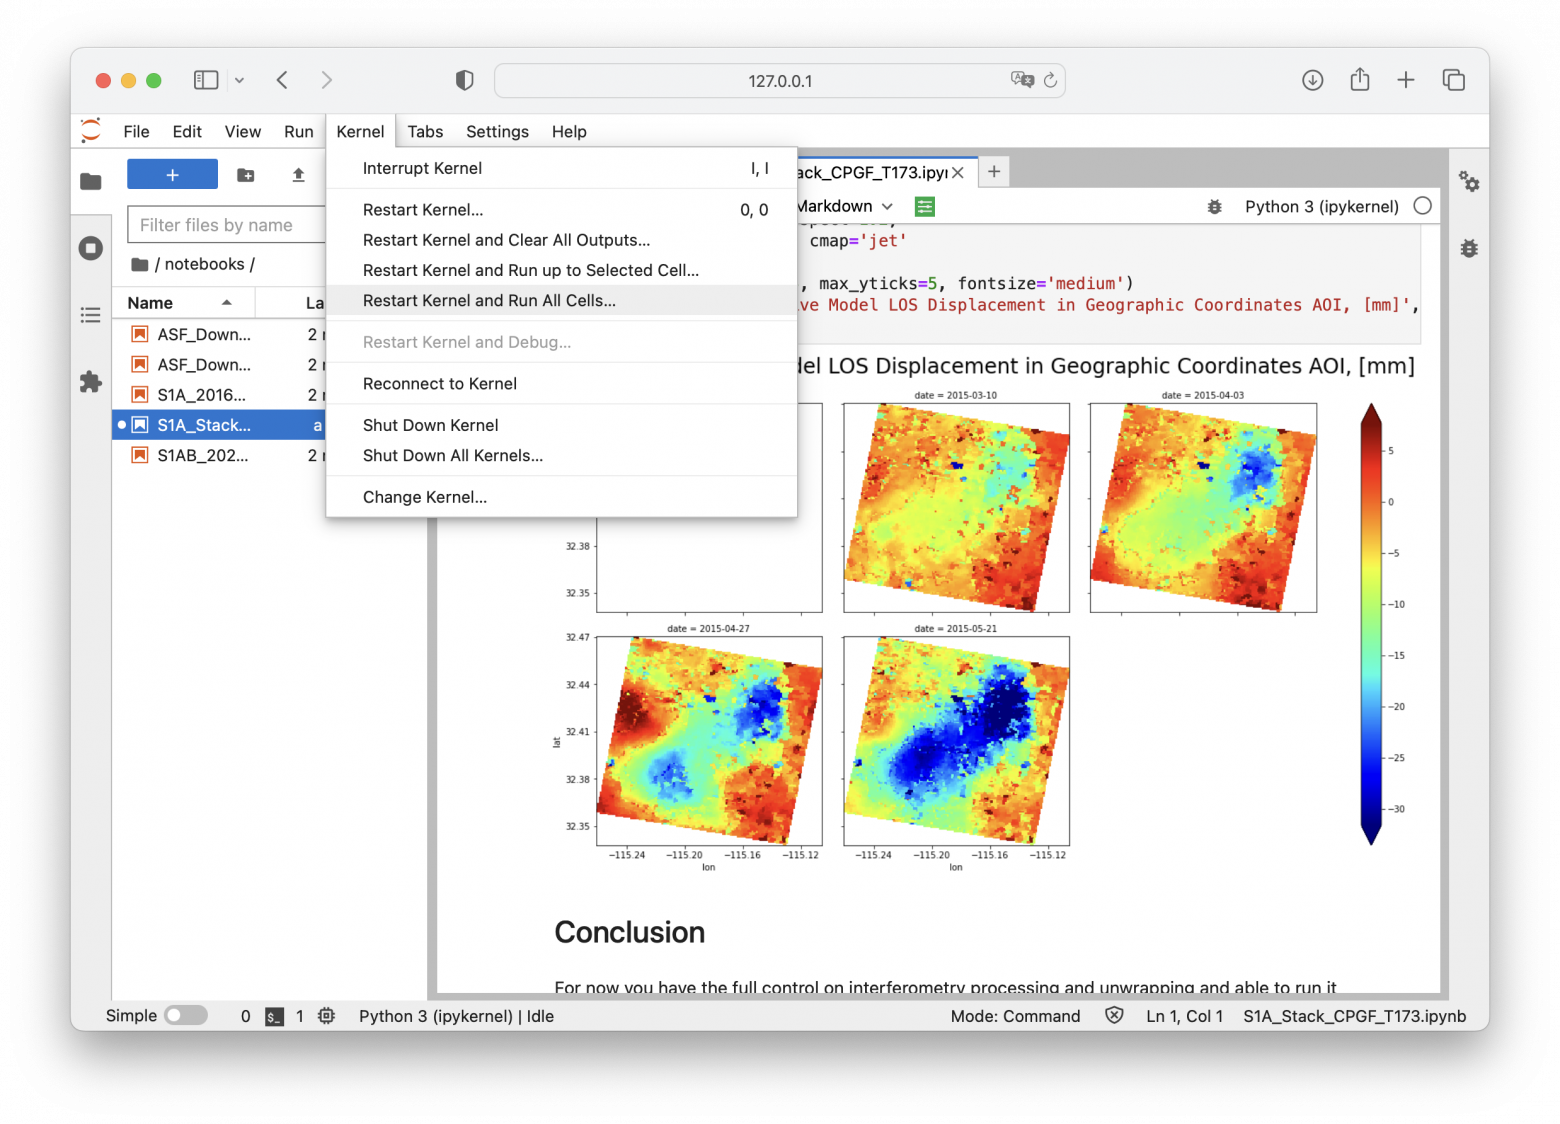
To run the complete example, use the toolbar menu item "Kernel" -> "Restart Kernel and Run All Cells...":
For now, you can follow all the execution steps interactively and stop and resume the processing and change all the parameters and see the results. That's the almost same interface as on Google Colab live online examples above, but without 3rd-side timeouts and processing limits.
Limitations
For now, only Sentinel-1 SLC scenes supported. That is possible to add other radar products processing in the future. Maybe I will do it when I have enough free time for this work. Today I'm more interested in better possibilities for Sentinel-1 data.
Learn more
- Documentation: https://github.com/mobigroup/gmtsar
- Issue tracker: https://github.com/mobigroup/gmtsar/issues
- Source code: https://github.com/mobigroup/gmtsar
- Docker Images: https://hub.docker.com/repository/docker/mobigroup/pygmtsar
- PyPI Python library: https://pypi.org/project/pygmtsar/
