
GDB is THE debugger for Linux programs. It’s super powerful. But its user-friendliness or lack thereof can actually make you throw your PC out of the window. But what’s important to understand about GDB is that GDB is not simply a tool, it’s a debugging framework for you to build upon. In this video, I’m gonna walk you through GDB setup for reverse engineering and show you all of the necessary commands and shortcuts for your debugging workflow.
GDB Setup With Plugins
The most common mistake I see is that people perceive GDB as a standalone debugger tool. I suggest you think of GDB as a debugger framework that allows you to build your own tools. Or you can use premade tools. My GDB-based tool of choice is Peda. It’s pretty easy to install, just follow installation instructions from Peda repository: https://github.com/longld/peda
git clone https://github.com/longld/peda.git ~/peda
echo "source ~/peda/peda.py" >> ~/.gdbinit
Program example
I’ll be using this simple program as our debugging target:
#include <stdio.h>int main() {int x = 5;printf("x = %d\n", x);x = x + 5;printf("x = %d", x);return 0;}This code creates local variable X on the stack, prints its value to the console, then adds 5 to X, and prints its value again. Pretty simple, just what we need for our learning example.
First Steps with Debugging a Program
To open a file in GDB, type gdb [filename] in the console. GDB will open and load your file. Notice, that code execution hasn’t started. That’s because there’s a separate command to start the execution, it’s called run, or r for short.
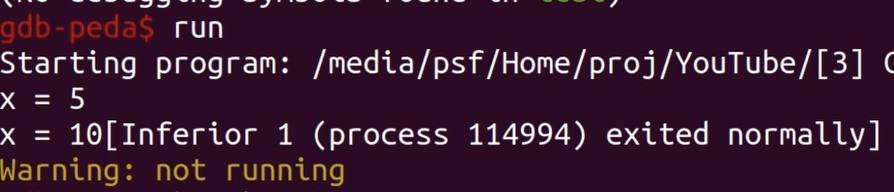
And if we start it, our program successfully completes execution. That’s because we haven’t set any breakpoints yet. We can set a breakpoint using symbol name, for example, break main, or using address: `break *0x555555555149`. You can print a list of all your breakpoints with ‘info breakpoints’ and delete them with delete <breakpoint number>.

Now if I issue run command, the execution conveniently stops at the beginning of the “main” function. And just to save us some time we can use command start which comes from Peda instead of doing all of this. This command will do all this work for us.
Of course, as with any other debugger, we can use single-stepping with command step or stepi.
And if you like to do single-stepping a lot, note, that pressing ‘Return’ on an empty line will make GDB execute the previous command you entered once more. Also, you can use command next to single step without entering function calls.
To step through several instructions at once you can use command next <number of instructions>.
If you want to continue execution to a certain point in a program (for example to exit a loop), you can use command xuntil <address or function>.
Modifying Registers
To modify registers, use following construction set$<register name> = 1234. For example, if I want to skip incrementing X, I can change the value of RIP register to 0x555555555176 with command set $RIP = 0x555555555176.

As you might have noticed, you can treat registers like variables in GDB. So I can assign RIP value of EAX with set $rip = $eax command. Now I can issue context command to make Peda reprint its beautiful context “window” to make sure that RIP points to some nonsense.

And I want to start execution from the start of ‘main’ function I can just write set $rip = main.
By the way, with Peda you have a faster way to skip instructions without executing them with skipi command.
Modifying Memory
Modifying memory is similar to modifying registers in the sense that any memory location can be a variable in GDB. So in my example, I want to change the contents of the format string “x = %d”. This string is located at 0x555555556004 in my binary. I can use this address as a variable and type in the same command as with registers: set 0x555555556004 = “AAAA%d”. But in this case, we’ll see an error message. That’s because you should always provide a variable type when modifying memory in GDB. So let me correct my command to set {char[7]}0x555555556004 = “AAAA%d”.

Print xprint hexdump hexprint
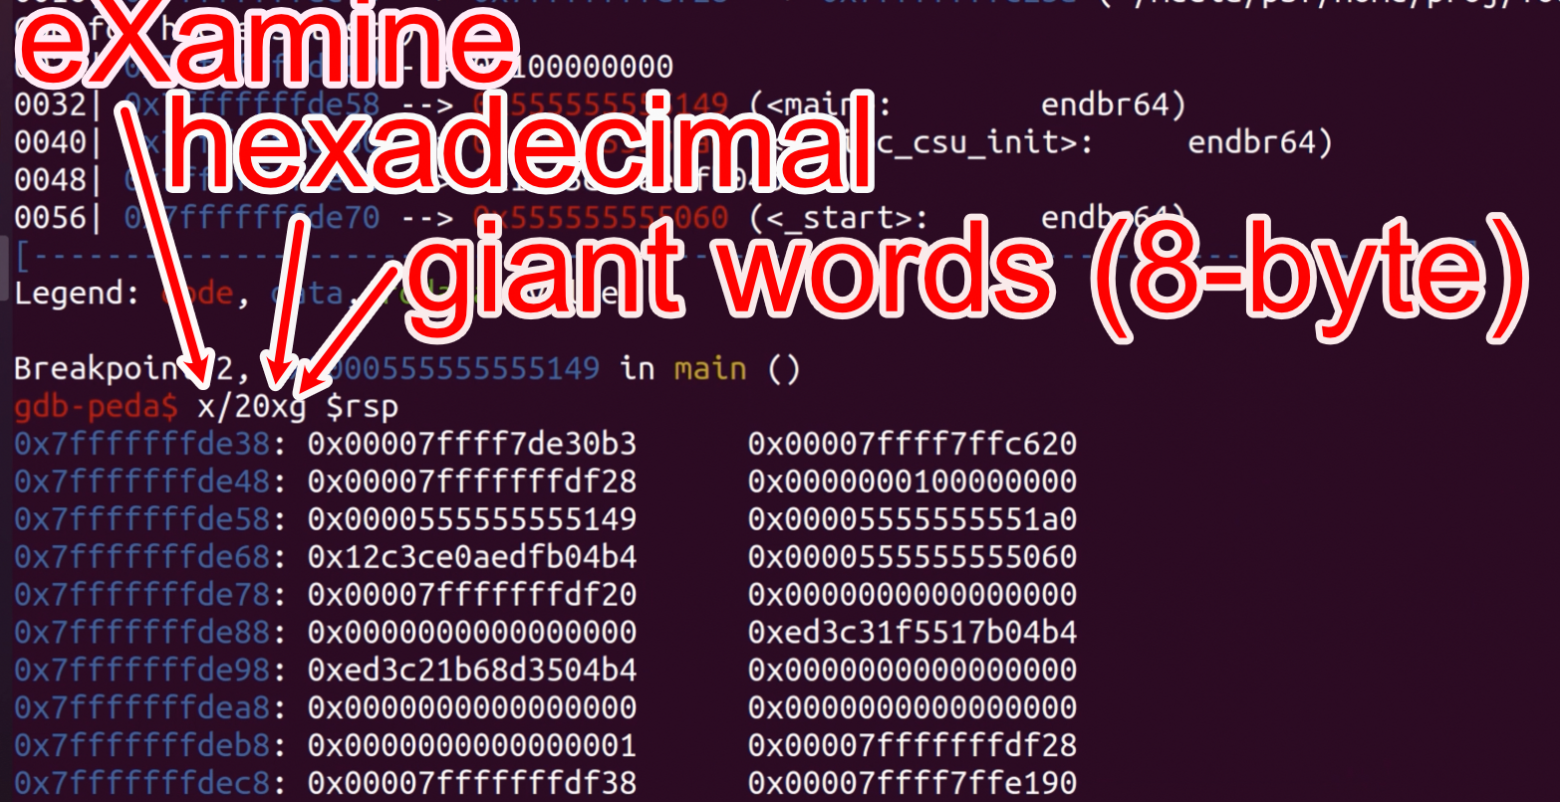
You can use the command x to examine memory. For example, if I want to print 20 8-byte words from the stack pointer, I’ll use command x/20xg $rsp: 20 — the number of words, x — hexadecimal format, g — giant (8-byte words).
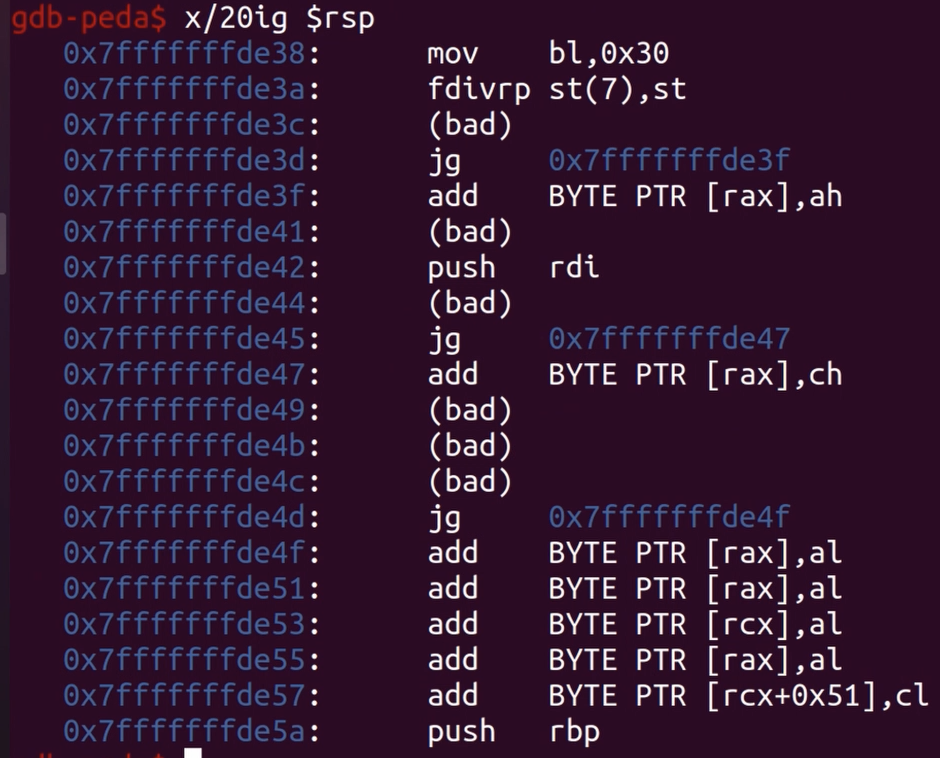
By changing the second x to i you can print memory as instructions.
The full list of supported modifiers you can find in the documentation:
From https://sourceware.org/gdb/current/onlinedocs/gdb/Memory.html
You can use the command
x(for “examine”) to examine memory in any of several formats, independently of your program’s data types.
x/nfu addrx addrxUse thexcommand to examine memory.n, f, and u are all optional parameters that specify how much memory to display and how to format it; addr is an expression giving the address where you want to start displaying memory. If you use defaults for nfu, you need not type the slash ‘/’. Several commands set convenient defaults for addr.
n, the repeat countThe repeat count is a decimal integer; the default is 1. It specifies how much memory (counting by units u) to display. If a negative number is specified, memory is examined backward from addr.f, the display formatThe display format is one of the formats used by
xorbBytes.hHalfwords (two bytes).wWords (four bytes). This is the initial default.gGiant words (eight bytes).
Also, Peda provides you with a convenient hexdump address /count (dump “count” lines, 16-bytes each) command which you can use… well, to display hex dump.

And if you want to print again all the stuff Peda shows to you (instructions, registers, stack, etc.), you command context.
Final Thoughts
So today we’ve seen a glimpse of GDB functionality. To sum up, I want you to take home 3 things:
use Peda or a different GDB plugin that suits you
use ‘break’ and ‘delete’ commands to control breakpoints
use ‘x’ command to print memory contents
If you have any further questions on GDB, please leave a comment below. Like the article, if you want more content like this. And happy hacking, you guys.
As always, instead of reading this article, you can watch the full video (bonus outtakes and cats included):
