I have already written about AIOps and machine learning methods in working with IT incidents, about hybrid umbrella monitoring and various approaches to service management. Now I would like to share a very specific algorithm, how one can quickly get information about functioning conditions of business applications using synthetic monitoring and how to build, on this basis, the health metric of business services at no special cost. The story is based on a real case of implementing the algorithm into the IT system of one of the airlines.
Currently there are many APM systems, such as Appdynamics, Dynatrace, and others, having a UX control module inside that uses synthetic checks. And if the task is to learn about failures quicker than customers, I will tell you why all these APM systems are not needed. Also, nowadays health metrics are a fashionable feature of APM and I will show how you can build them without APM.

Why another solution when there are already several IT monitors?
Well-configured IT monitoring allows to remove many IT support tasks, but it has some limitations in solving several problems:
1. First of all, the planes
Technical monitoring does not allow assessing the state of business functions of IT systems and infrastructure at sites. For example, when a communication channel on a site is lost, this is an event for a network engineer but not for the business. We have more complex cases, when there are several rooms with terminals where flight crews must go through a check-in procedure and there are up to five terminals in each room. It is understood that during the "fly-off" a breakdown of one or two terminals in a room does not affect the procedure, but three or four breakdowns could create a queue for the flight crews, which may affect the performance of one of the important metrics - " fulfillment of the flight plan”, so, a part of the flight crew must be sent to another room. With a loss of five terminals, we lose a number of business functions in this room and BCP (Business Continuity Planning) procedure is launched - an action plan when a business works without access to IT systems. It is difficult to set up such cases with simple technical monitoring, and product teams need a simple tool that does not require deep competencies in IT monitoring.
2. Check performance of applications, but don’t dig into the processing of results
It is almost impossible to provide 100% covering of complex systems by monitoring metrics or logs. There is always something that is hidden from monitoring, due to which business functions of the system may be unavailable or degraded. And here it comes handy the way of checking the state of the system through emulation of actions of a customer using the method of synthetic transactions, that is, imitation of how a person in a browser or on an application client clicks on buttons and gets a certain result. Such an emulation is guaranteed to tell about the availability of the business function for other users. But there might be many systems and tests and it is laborious and time-consuming to view the results for each of them. That is why we also need a tool for "orchestration" of synthetic tests and visualization of the results.
3. Stop calling and asking "the only one who knows"
In organizations with large IT infrastructure all systems are intertwined with each other by integrations so that it is sometimes difficult to understand where one system ends and another begins. As a result, if one system fails it is not at all obvious how it will affect other systems. Information about the interconnection of systems is usually stored only in one "repository" - in the heads of technical leads of product teams. It is necessary to make this data open and accessible so that in the event of a failure it would not be necessary to pry out any available information from employees. This problem could be solved by a resource-service model (RSM) which would reflect the influence of various elements of the infrastructure on the stability of the business.
4. Houston, we have a problem... or not?
Specifically, this airline used several monitoring systems:
monitoring of "boxes" and communication channels: Zabbix, Prometheus for systems in Kubernetes,
monitoring of logs on the platform of the ELK family (elastic - logstash - kibana).
Any of those could report deviations and, in general, there was no common place where one can see the state of the components as a whole.
5. Reports are not for the sake of reports
Management wants to see the health of business functions, not IT components, both in retrospect and in real time. Reports should be available in one place with visualizations that are understandable for "not techies", and not in interfaces created by engineers for engineers (like Zabbix or Grafana dashboards). Such reports should be daily and reflect what happened during the day in areas of responsibility of different performers and what events influenced the degradation of a particular service. Previously, such reports were often subjective because they were based on summaries provided by the engineers about significant events. As a rule, the management had to call each person in charge personally and clarify the details.
6. Where to run first?
There was also a need to calculate SLA taking into account the impact on the business. For example, there is a flight to a certain city on Wednesdays. The inaccessibility of communication with the airport on other days, as well as on the day of the flight around five o'clock before departure, in fact, has no effect on the business. I would like to take this into account when analyzing the SLA for the period. In addition, SLA should help engineers prioritize actions: it is one thing if an event occurs around the departure time, when you have to react to it 24/7 and urgently, another thing if no one plans to use IT functions in the near future, than such events can just be put in the common queue. It was wanted to solve these problems with an intuitive tool that does not require deep technical competencies from product teams.
We began to implement a solution that would cover all these tasks that are not handled properly by IT monitoring. As a result, we come up with the following set of monitoring components:
Zabbix and Prometheus for metrics analysis,
ELK for analysis of logs,
Jenkins for managing the launch of synthetic checks which are, in fact, autotests, plus Selenium as a library with which the autotests are written in Python,
Monq for aggregating all events, orchestrating synthetic checks, combined analytics and process automation.
In this case, the first two components were already in place, and the second two had to be installed and integrated with each other.
It was necessary to solve the following tasks:
Ensure that the solution can act as a single common place for data aggregation from all current monitoring systems,
Visualize and bring onto a single screen the results of functional synthetic tests, both for web interfaces and for desktop applications,
Build a resource-service model of services within the entire IT infrastructure,
Configure alert-based automatic responses and test the script-based automation capabilities.
To install the platform and the necessary environment for functional monitoring, we needed to allocate 11 virtual machines (4 went for monq, 7 for Jenkins nodes). Allocating resources was perhaps the longest phase of our project.
Synthetic monitoring
Synthetic monitoring is an imitation of actions that could be performed by users or external systems, followed by monitoring the results of these actions. It is sometimes also referred to as functional monitoring or synthetic transaction monitoring.
As I wrote above, in this project we needed to show the client that we can test web interfaces, desktop applications, and check the availability of business functions.
As a result, a number of functional autotests were written that tested business functions. The tests were relatively small and consisted of several steps, the periodicity of launching the tests was 5 minutes. The key issue was to check authorization in systems and to check the delivery of visualised important information for end users. For each step in the test, triggers were configured for exceeding the step critical execution time.
In the end, we saw the test results, based on which it was already possible to evaluate the work of the business functions of our applications, due to the fact that an error, because of which one or another step has failed, is visible in the interface and a screenshot of the error is available at any moment.
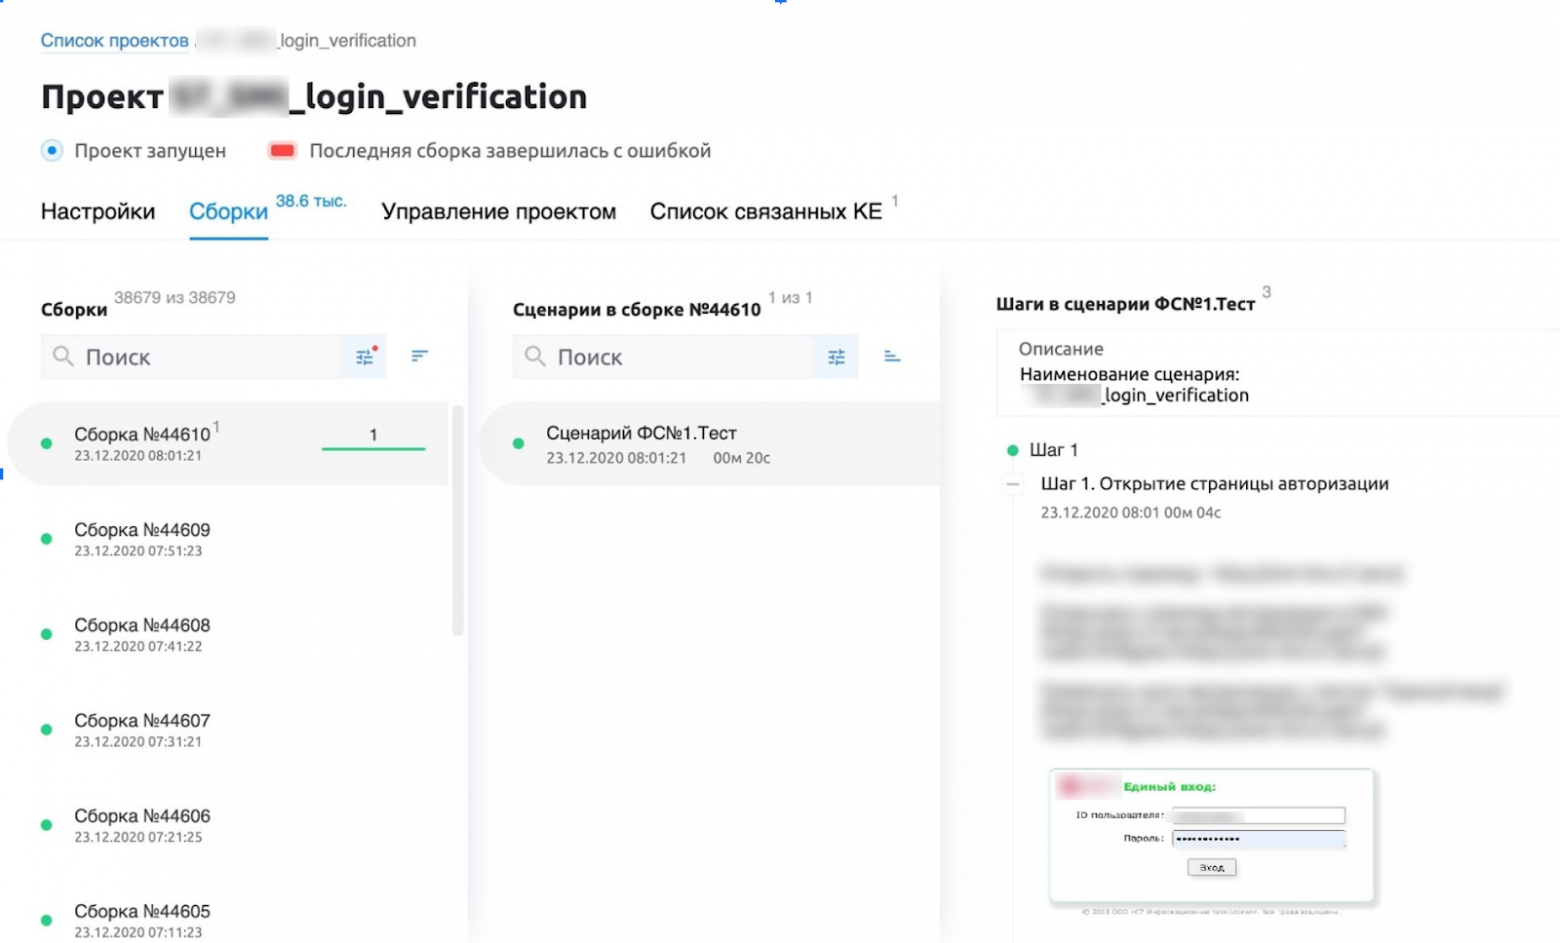
An example of authorization check on an intranet portal

An example of checking the availability of the table of flights
I will describe in more details the logic of a web test, step by step (the pictures are mostly in russian since they are real screenshots of the working installation in one of the russian airlines).
1. Open the authorization portal page. Check if there is a text - "Single sign-on":
browser.timeout = 25

    with allure.step('Step 1. Opening the login page'):

        try:

            browser.get("https://***/")

            browser.xpath("/html/body/div[2]")

            assert browser.xpath("/html/body/div[2]/div[1]/span[contains(text(), 'Single sign-on:')]")

            allure.attach('screenshot', browser.get_screenshot_as_png(), type=AttachmentType.PNG)

        except:

            allure.attach('error_screen', browser.get_screenshot_as_png(), type=AttachmentType.PNG)

            raise
2. We enter the required authorization data and click on the "Login" button:
with allure.step(‘Step 2. User authorization'):

        try:

            smi_login = browser.xpath("//*[@id='IDToken1']")

            smi_login.click()

            smi_login.send_keys("***")

            smi_password = browser.xpath("//*[@id='IDToken2']")

            smi_password.click()

            smi_password.send_keys("***")

            browser.xpath("/html/body/div[2]/div[2]/form/input[1]").click()

          assert browser.xpath("/html/body/app-root/div/div/s7-header/div/div/div/div/div[1]/h1[contains(text(), 'Flight table')]")

           allure.attach('screenshot', browser.get_screenshot_as_png(), type=AttachmentType.PNG)

        except:

            allure.attach('error_screen', browser.get_screenshot_as_png(), type=AttachmentType.PNG)

            raise
3. Open the page with information on the flight. Select a flight, click on it, the flight information window opens and check for the presence of the text "Flight Information":
with allure.step('Step 3. Opening the flight information page'):


        try:

        browser.xpath("//*[@id='flightTable']/tbody/tr[1]/td[1]").click()

            browser.xpath("/html/body/app-root/div/div/main/flight-info/div/div/leg-info/div/div/div[1]/div[1]/passengers-summary/div/div[1]/div[2]/div[1][contains(text(), 'Flight Information')]")

            allure.attach('screenshot', browser.get_screenshot_as_png(), type=AttachmentType.PNG)

        except:

            allure.attach('error_screen', browser.get_screenshot_as_png(), type=AttachmentType.PNG)

            raise
Digital health of services
A digital health metric is a metric that shows how much an IT infrastructure element, service or business function meets the needs of customers (other IT components or end users). The service health is calculated based on internal audits and the impact of influence from other RSM related IT components. For example, if we have three database nodes, with one master and two slaves, and the master node goes down then the health will drop to zero, and if a slave node goes down then the health simply be less than 100%, in accordance with the weighting coefficients of influence as defined in the solution architecture.
So, at this stage, the platform has already received events, the results of synthetic checks were present and we proceeded to one of the most interesting things - the creation of a resource-service model for the terminals in which flight crews undergo check-in.
We have divided all terminals into points of presence (airports) and their actual location inside the building, so that it would be easier to navigate visually and later it would be easier to set up automation, depending on location and its importance.

The RSM screen shows relationships among elements and their influence on each other. In the event of a failure in one CU, the associated CUs will light up in red.

One can also look at the state of the elements on the RSM map with their contributions to the CU health level.
For convenience, we have set up several different RSM views for different levels of employees.
L1 - the health of the "business" as a whole is visible.
L2 - health of separate information systems. We also included the results of functional monitoring here. If we see errors in the tests, we can go deeper and see in more detail what is happening at the infrastructure level and what events contribute to the degradation or inaccessibility of the IT systems.
L3 is the most detailed view that describes the workings of every single element in the infrastructure.
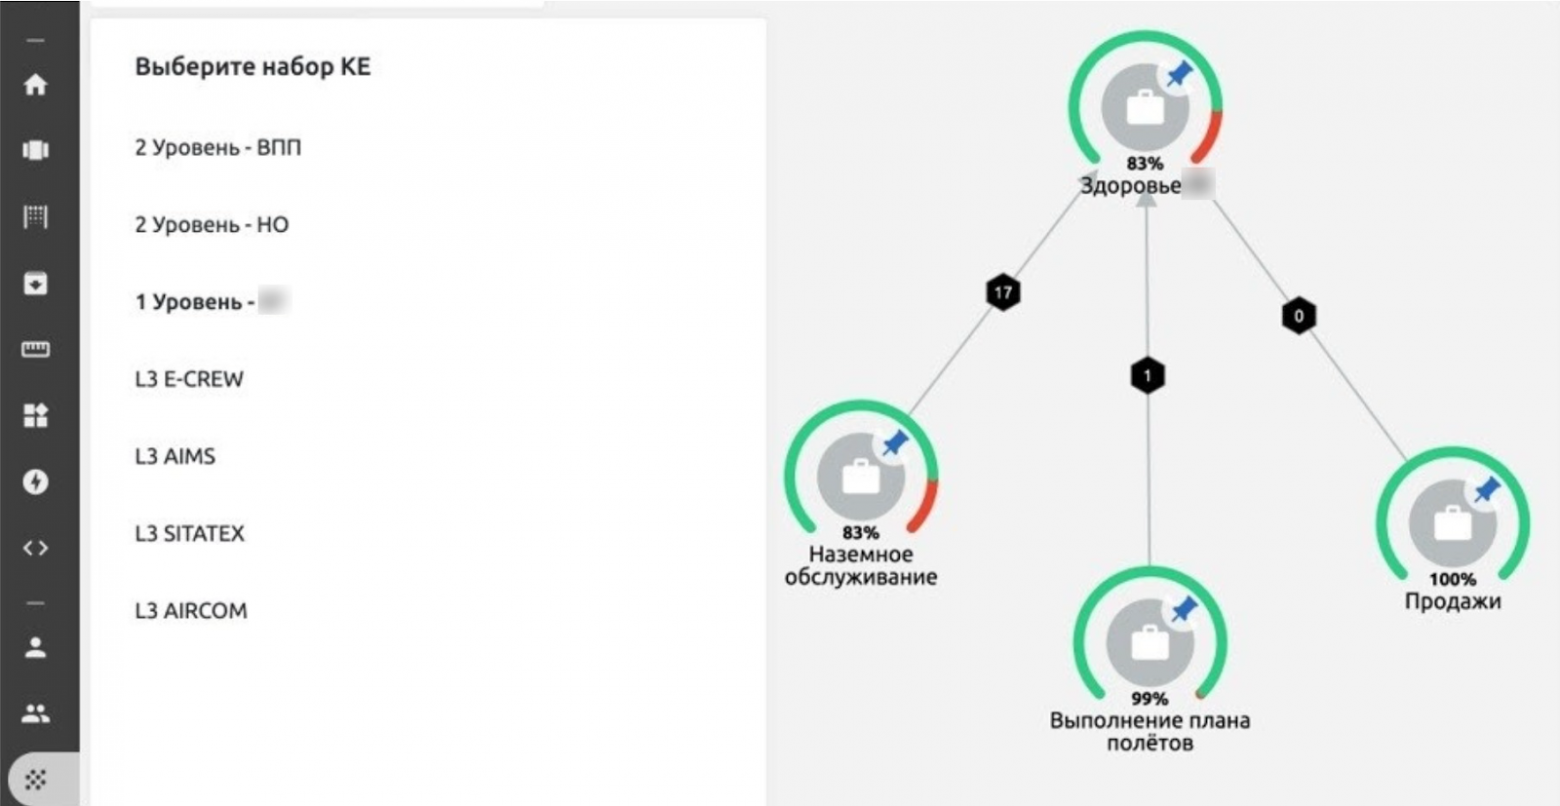
At the top level you can see the health of the main IT services of the company.
Based on the health metrics of the services we set up automatic responses, where for some events scripts were set up to control the end devices. But this is another story so I will not describe it within the framework of this article. Most importantly, in two months we configured the visual display of the most important IT health metrics for business, built on synthetic checks of logs and metrics from the IT infrastructure with root cause analysis. The cost of software products for these two months was less than 150 thousand rubles (about $2000), and labor costs - 2.5 people at full time. It seems to me a good result. Any APM solution would be an order of magnitude more expensive.
