Java 8 introduced two kinds of functional expressions: lambda expressions like s -> System.out.println(s) and method references like System.out::println. At first, developers were more enthusiastic about method references: they are often more compact, you don't need to think up the parameter name, and, as urban legends say, method references are somewhat more optimal than lambda expressions. Over time, however, the enthusiasm waned. One of the problems with method references is the difficulty in debugging.
Let's write a simple program where an exception goes through the functional expression. For example:
import java.util.Objects;
import java.util.function.Consumer;

public class Test {
  public static void main(String[] args) {
    Consumer<Object> consumer = obj -> Objects.requireNonNull(obj);

    consumer.accept(null);
  }
}
I'll run it on the early access build of Java 17, which will be released soon. It produces the following exception:
Exception in thread "main" java.lang.NullPointerException
    at java.base/java.util.Objects.requireNonNull(Objects.java:208)
    at Test.lambda$main$0(Test.java:6)
    at Test.main(Test.java:8)
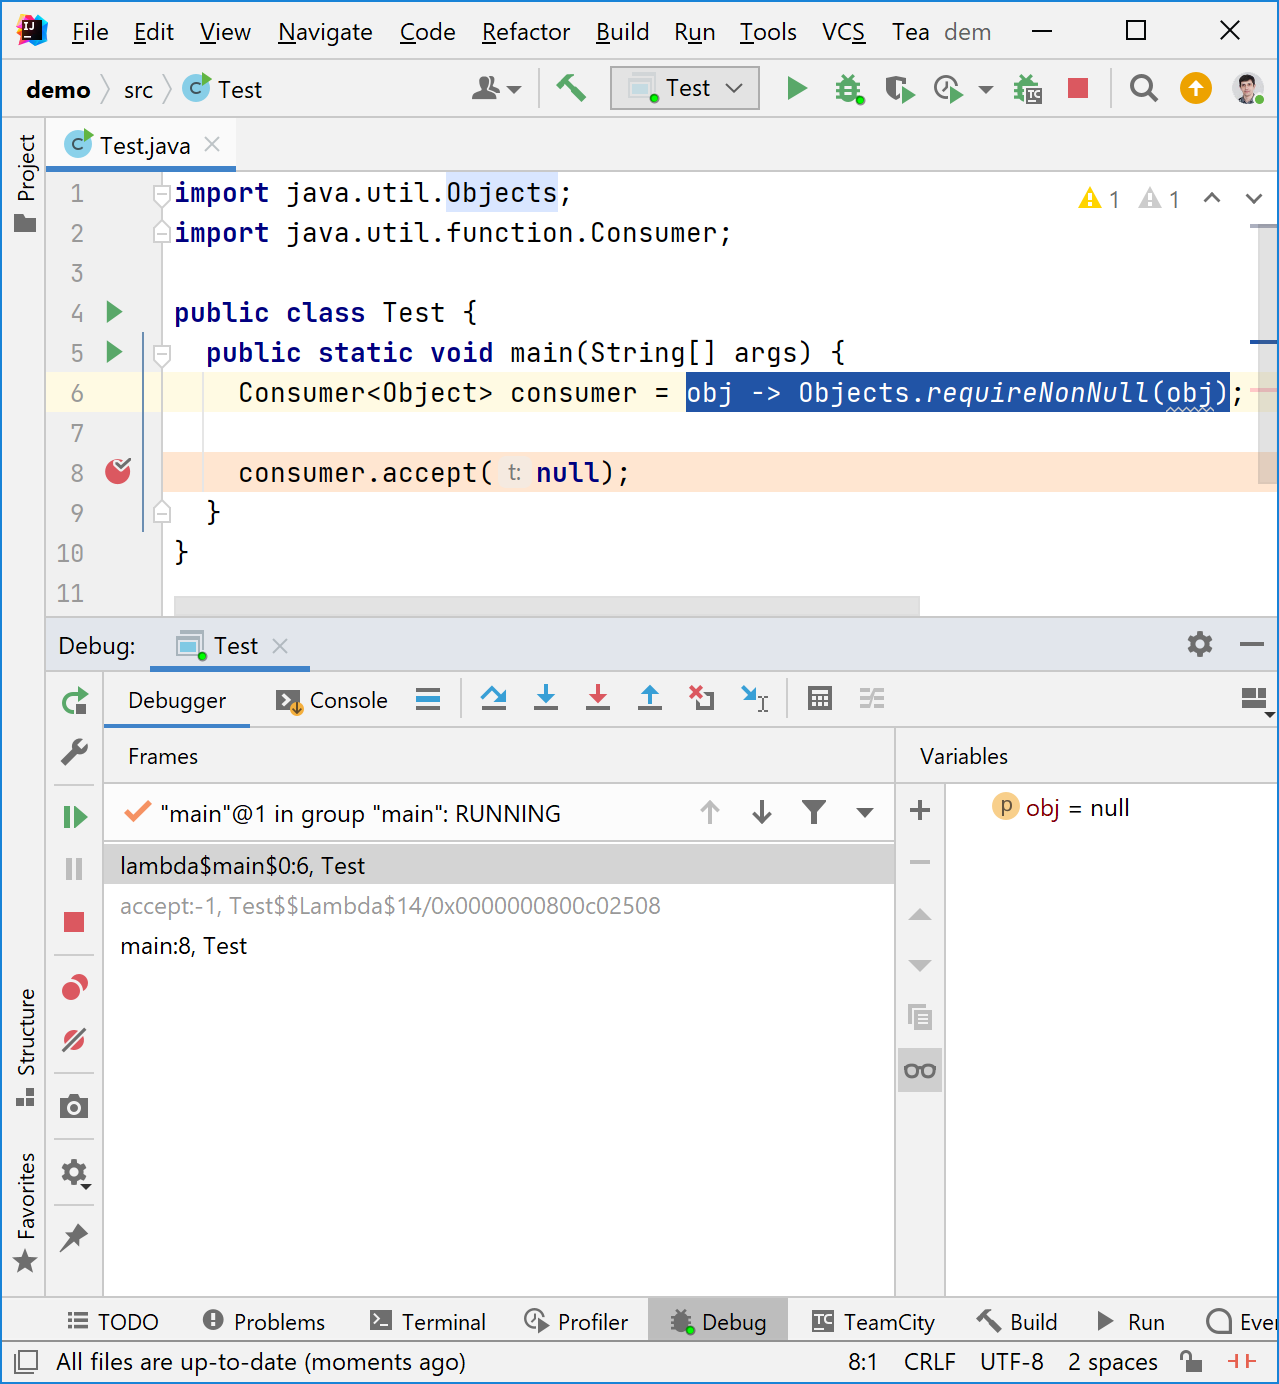
This is a good stack trace. It contains both a function call site (Test.java:8) and a function definition point (Test.java:6). Also, the IDE debugger allows you to step inside the lambda:
Now, let's replace the lambda with a method reference:
  public static void main(String[] args) {
    Consumer<Object> consumer = Objects::requireNonNull;

    consumer.accept(null);
  }
Launch again and see:
Exception in thread "main" java.lang.NullPointerException
    at java.base/java.util.Objects.requireNonNull(Objects.java:208)
    at Test.main(Test.java:8)
Oops, we have a problem. We don't see the function creation point in the stack trace anymore. Unlike lambdas, no synthetic method is generated in the class for a method reference, so there is no place to attach the line number information.
Some developers might think that the problem is minor. However, in large programs, the creation point and the function call site can be in completely different places, and the lack of information about where the function was created can significantly complicate the error diagnosis. A similar problem is observed in the step-by-step debugger: even if you use "Force step into" feature, you never get to the Objects::requireNonNull line:
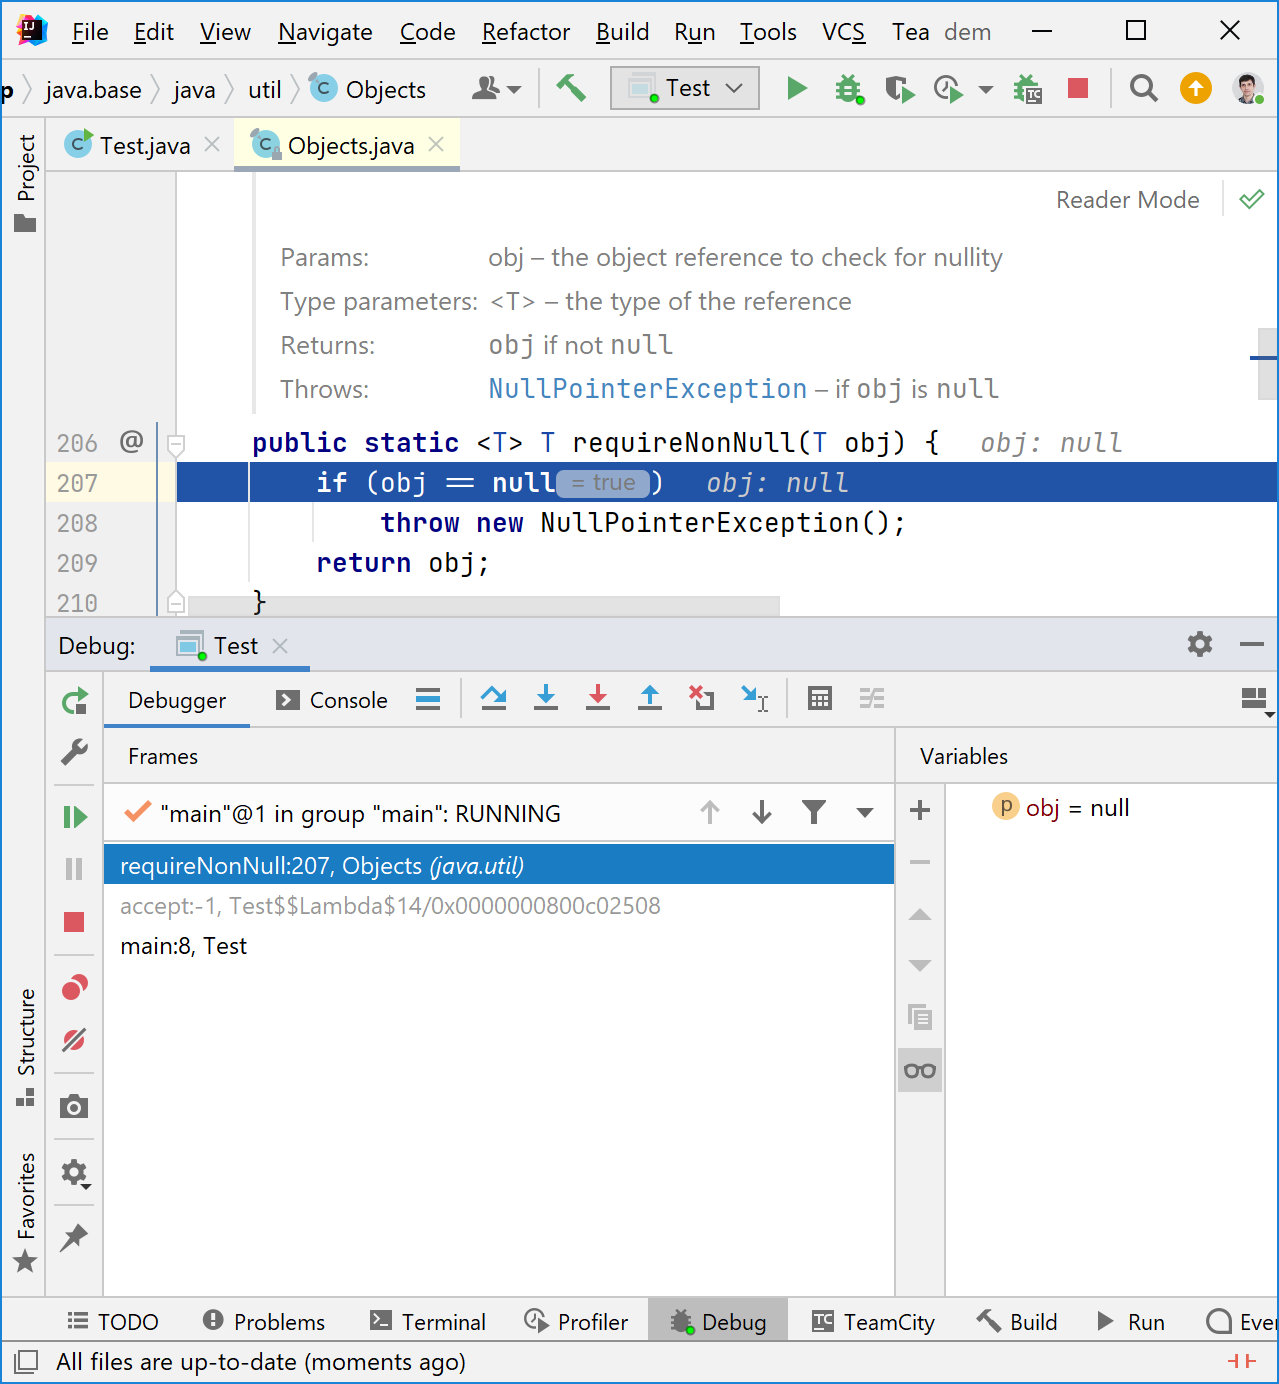
Instead, the debugger will immediately jump inside the called Objects::requireNonNull method. That's because by the time the function is called, the virtual machine is completely unaware of where the function was created. And you never know how many method references in your program refer to this method, so you may need to check tons of them!
It would be great to create some kind of intermediate frame in the stack and attach the necessary debugging information to it. Wait, we already have an intermediate frame! See the gray line accept:-1, Test$$Lambda$14/0x0000000800c02508 in the debugger? This is it.
To adapt a function to a functional interface, the Java runtime generates a small class that actually implements our interface. This code generation is implemented in the InnerClassLambdaMetafactory::generateInnerClass method. In theory, we can patch this code and add debug information to this frame. We only need to know the file name and the line number where the function is created. But where to get it from? It's very simple: when the generation of a synthetic class is called, the current stack trace contains everything we need. To verify this, just put a breakpoint there:

There are some Java runtime internals, ending with "linkCallSite:271, MethodHandleNatives", and after that, we see what we need: a line number 6 inside the "main" method. How can we fetch this information at runtime? There's a fancy StackWalker API, which is convenient, modern, and fast. There's one problem though: it requires Stream API, but Stream API creates some functions inside, and these functions are bootstrapped using the same InnerClassLambdaMetafactory. If you try to do this, you'll get StackOverflowError during the VM initialization. Probably, there's a way to work-around this problem. For example, one may use Reflection::getCallerClass internal API, check the caller class and disable stack walking if the caller is a part of the standard library. But we will take a simpler route: just use good old new Exception().getStackTrace(). It might be slower, but remember that the bootstrap method is called only once per function, so the hot code won't be harmed at all. Let's write something like this (boy, it's so hard to write code without the Stream API):
private static StackTraceElement getCallerFrame() {
    StackTraceElement[] trace = new Exception().getStackTrace();
    for (int i = 0; i < trace.length - 1; i++) {
        StackTraceElement ste = trace[i];
        if (ste.getClassName().equals("java.lang.invoke.MethodHandleNatives") &&
            ste.getMethodName().equals("linkCallSite")) {
            return trace[i + 1];
        }
    }
    return null;
}
Return null if something went wrong. In this case, we should not break the program, we can just behave as before.
Great, we've got the necessary information. Now, how to put it inside the generated class? Here, we have good news: JDK uses well-known ASM library for code generation (it's shaded inside the JDK), so adding necessary debug info is a piece of cake. For example, to add a source file name, we should write something like this:
StackTraceElement ste = getCallerFrame();
if (ste != null) {
    cw.visitSource(ste.getFileName(), null);
}
We need a little bit more fuss to add a line number. We should pass it into ForwardingMethodGenerator::generate, where a functional interface single abstract method implementation is generated. Then we need to create a label at the generated method entry and add an entry into line numbers table:
Label start = new Label();
visitLabel(start);
...
if (lineNumber >= 0) {
    visitLineNumber(lineNumber, start);
}
That's basically it. You can take the complete patch here and apply it to OpenJDK code (to revision 57611b30 which is the latest revision at the time this article is written). Now, you can compile the patched file using Java 17 compiler, like this:
"C:\Program Files\Java\jdk-17\bin\javac.exe" --patch-module java.base=src/ -d mypatch src/java/lang/invoke/*
We assume that the patched file is in src/java/lang/invoke and the output class files go into mypatch directory. Finally, we can run our test application adding --patch-module java.base=mypatch command line option.
First, let's check the step-by-step debugger:
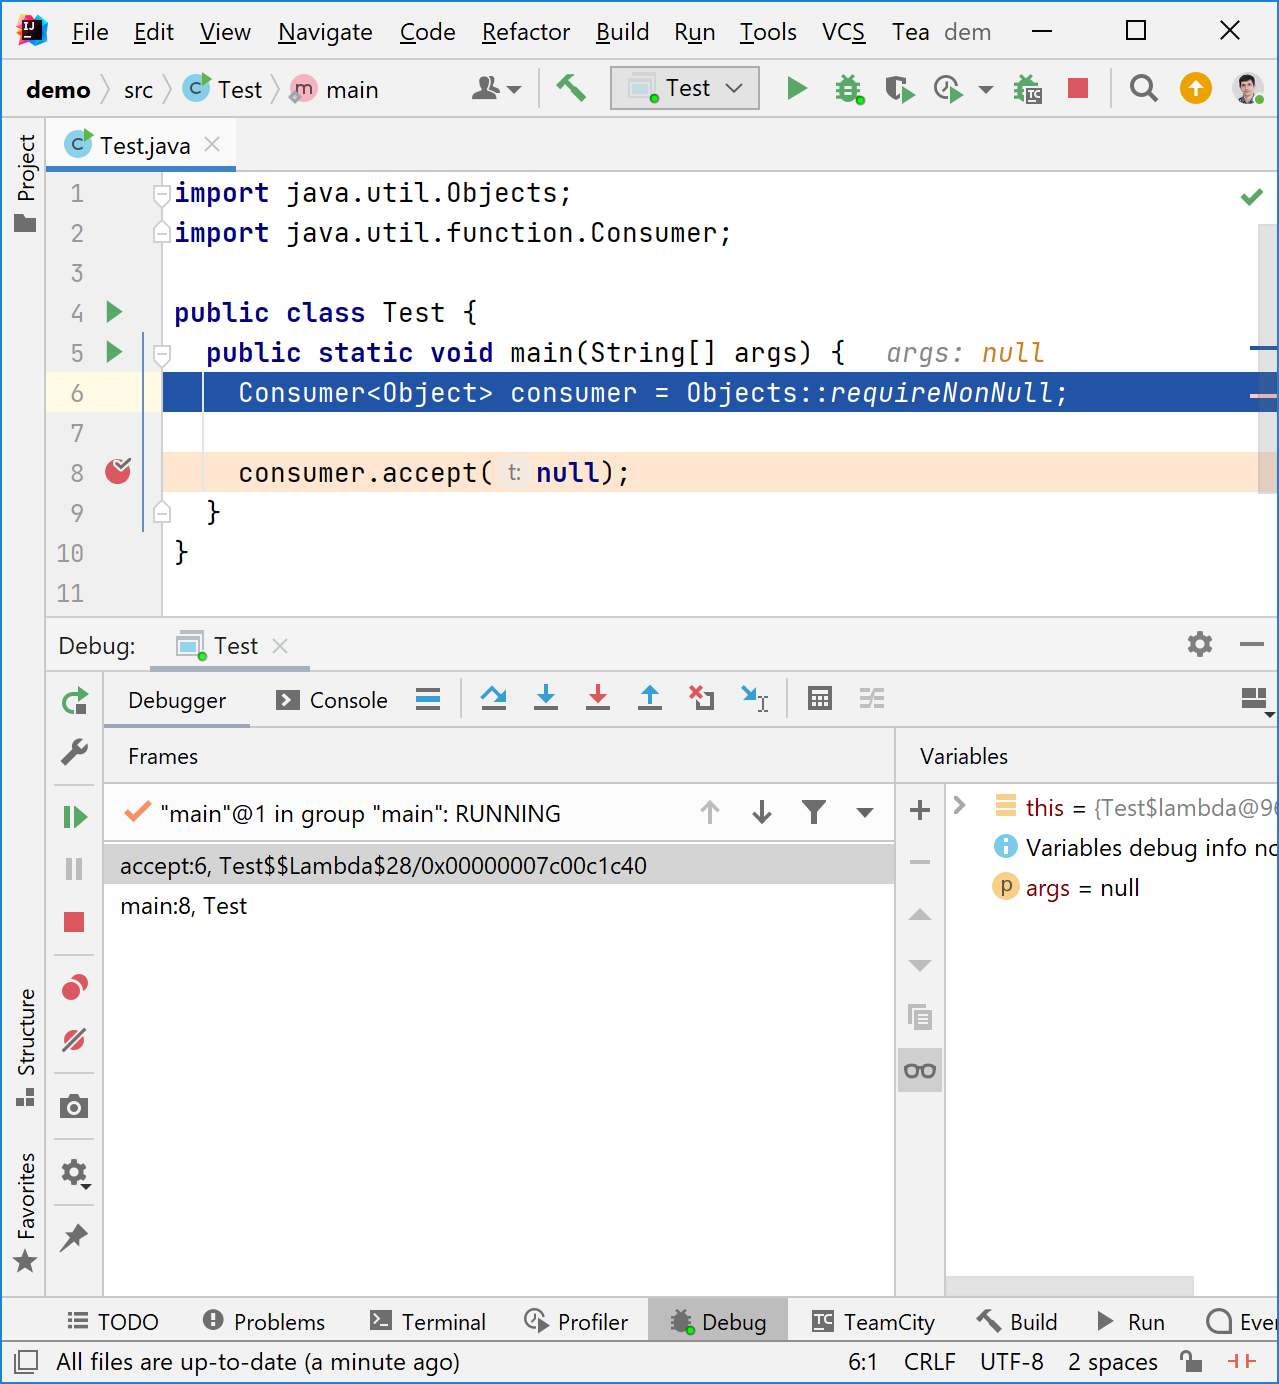
Hurray, "Force Step Into" really brought us to the right place! The accept method now has a line number #6, which is exactly what we wanted! Well, IntelliJ IDEA went a little crazy, because it did not understand where we are. As a result, it decided that the function argument null is the args parameter of the main method. But this is not a big problem, you can ignore it. After all, the development environment can also be taught to recognize such frames. The thing is that now, by stepping into the method reference call, we can find out where it was declared.
What about exception stack-trace? Unfortunately, it did not magically change. That's because the synthesized adapter class is a very special "hidden" class. Among other things, hidden class frames are excluded from the stack traces by default. But we can turn them on via -XX:+UnlockDiagnosticVMOptions -XX:+ShowHiddenFrames VM options. Now, we can finally see the frame we need:
Exception in thread "main" java.lang.NullPointerException
    at java.base/java.util.Objects.requireNonNull(Objects.java:208)
    at Test$$Lambda$28/0x00000007c00c0880.accept(Test.java:6)
    at Test.main(Test.java:8)
It doesn't seem too bad if this option is kept enabled in production. Well, stack traces in logs will become a little longer, but also more useful! In general, it's cool that now more and more internal things in the Java runtime are written in Java itself. As a result, to make such a patch, you don't have to get into the scary C++ code and rebuild the virtual machine completely. It is enough to rebuild a single class only.
It is clear that no one in their right mind will accept such a patch into OpenJDK. I will not even try to propose it. But you can use it locally. Of course, I do not give any guarantees that it will work correctly for you!
