Creating Real-Time Dashboards on Streaming Data in Power BI
Invite pending
REAL TIME DASHBOARD IN POWER BI

We frequently come across real-time or streaming data in our daily lives. It is so ubiquitous that we don’t even realise that the processes we are interacting with is generating real-time data e.g. our activities on an e-commerce website or body vitals measured by wearables.
What is real-time data?
Real-time data need to be streamed before using it; much like we stream movies from Netflix. Streaming is needed for downstream analytics on the real-time data. There are streaming applications like Kafka, EventHub, Spark Streaming etc which do this job – to stream data real-time between producers and consumers of IoT data. We will discuss about them in detail later in the article. Streaming data generally have high volume and velocity.
Some of the popular example and sources of real-time data are as follows:
- Data generated by IoT sensors measuring pressure, temperature, acceleration recording every milli-seconds or faster.
- Click stream data i.e. log (where, when, how many times) of user clicks on the websites.
- Stream of tweets containing a particular hashtag.
- Stock market ticker data getting updated at a high frequency.
- Retail bank transactions including funds transfer, OTP transfer/receipt etc.
What is real-time dashboard and what can I use it for?
A real time dashboard contains visualizations that are updated in real-time with the change in data. These dashboards provide information that is useful for identifying emerging trends and monitoring efficiency. Real time dashboards usually contain data that is time — dependent.
There are a variety of use cases in multiple industries for real time dashboards.
- One of the most common applications is deploying just-in time inventory management. Companies that prefer minimal warehousing require constant real-time data about current in-store levels, sales, and how quickly they can be replenished.
- Another application is real-time alarms and preventive maintenance of equipment in manufacturing and oil & gas industries. This is done by multivariate outlier detection methods like Mahalanobis distance, time-series classification methods like Shapelets and time-based regression methods like survival analysis.
How to process streaming data?
There are various tools & technologies that are used for stream analytics which includes Kafka, Kinesis and Flume. Kafka, for example, is an open-source tool for streaming data. It has
- A producer which sends messages to a topic at regular intervals of time
- A broker which stores the data temporarily and partitions the messages accordingly
- A consumer which subscribes for a specific topic and consumes the streamed data
How to create a real-time dashboard
In this blog we are going to create a real-time dashboard in Power BI. For this purpose, we will
- Generate real-time data through Random module in Python
- Stream real-time data via EventHub (equivalent of Kafka) in Microsoft Azure
- Pass the data to Azure Streaming Analytics which will pass it to Power BI
- Plot real-time data in Power BI dashboard which will help business users to get to know what is going on from time to time.
- Real-time data can be stored over time and can be warehoused in databases like Azure SQL
A schematic of the architecture for a real-time dashboard would look like below
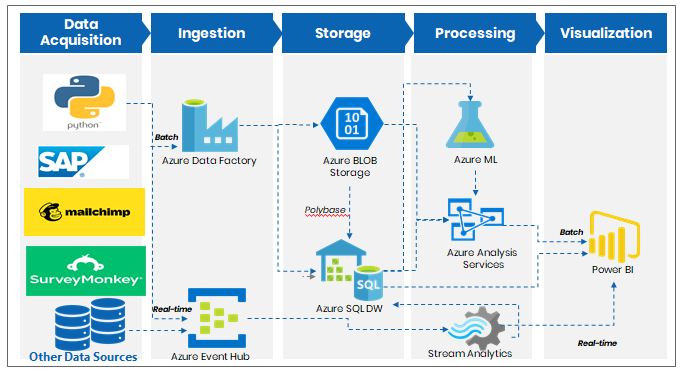
Fig.1 A schematic diagram of architecture of real-time dashboard
Without further ado, let us get our hands dirty and create a real-time dashboard.
Before we move on, we will need the following prerequisites in order to proceed further.
- Microsoft Azure Account, you can get free credits worth $300 on sign up which would be enough to create this demo
- Python installed on your computer
- Power BI Pro Account, available for $10/month
Power BI Pro account is needed to create a streaming real-time dashboard, since we need to stream data continuously which is available only in Power BI Service and a feature which is not available in Power bi desktop version.
We use Azure Stream Analytics for generating the data from time to time. It is simply an event-processing engine which can accept data from any sources such as devices, sensors, websites, social media feeds, applications, infrastructure systems, and more. Microsoft Azure ecosystem consisting of EventHub and Streaming Analytics acts as a link between Python and Power BI.
You can follow the following steps to make your machine ready to work with real-time data.
Step 1: Login to Azure account and you should see the following screen
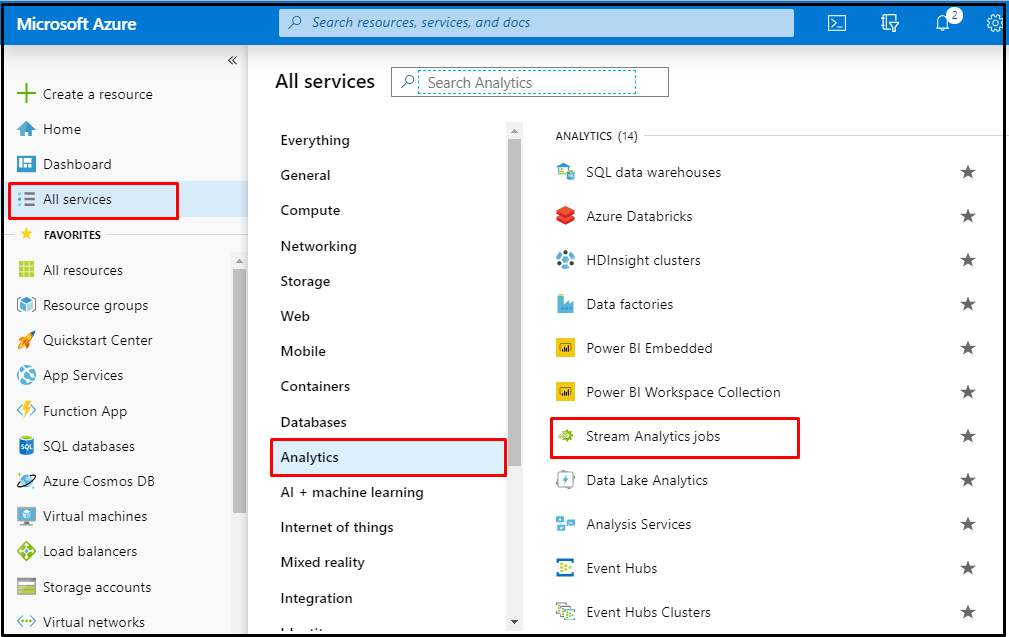
Step 2: Create a Stream Analytics job in Microsoft Azure.
Find ‘All services’ from the left pane and select ‘Stream Analytics jobs’ under ‘Analytics’ topic.
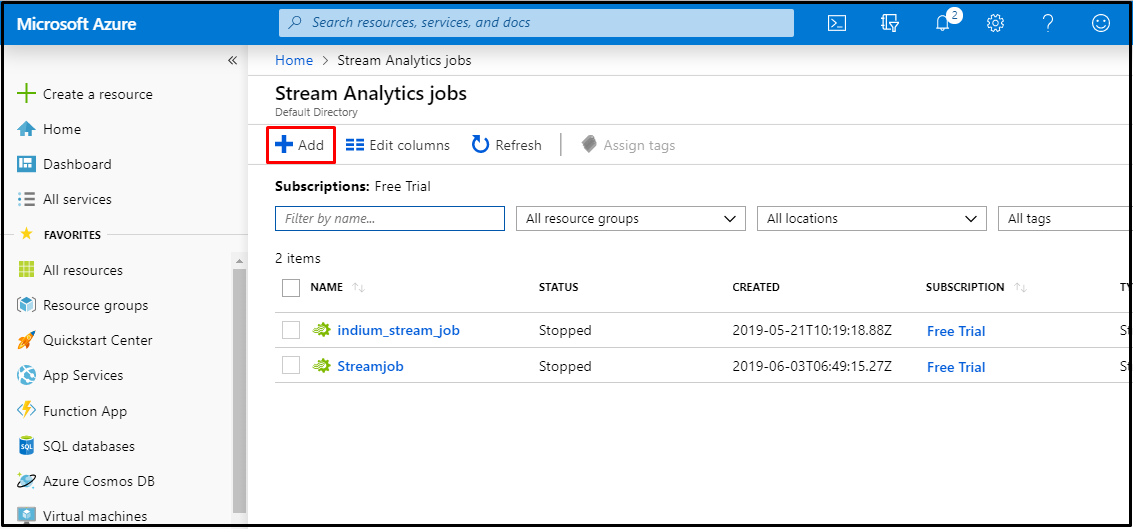
Click on ‘Add’ and enter your stream job name in it under text box named ‘Job’.
Under ‘Resource group’ you can either use your old resource group from the dropdown list provided or you can create a new resource by selecting the ‘create new ‘option.
Note: Remember the location you have selected, since you might need to use the same location for the upcoming steps.
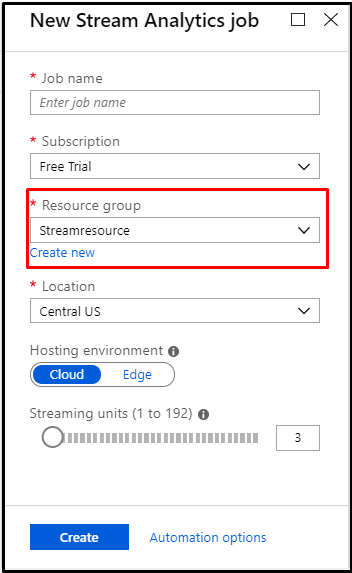
Click on ‘Create’ and voila! Your stream analytics job is created.
Step3: Create Event Hub engine
Event Hub is a fully managed, real-time data ingestion service that is simple, trusted and scalable. We need to create a namespace for our Event Hub engine in our process. Follow the below steps for setting up this engine
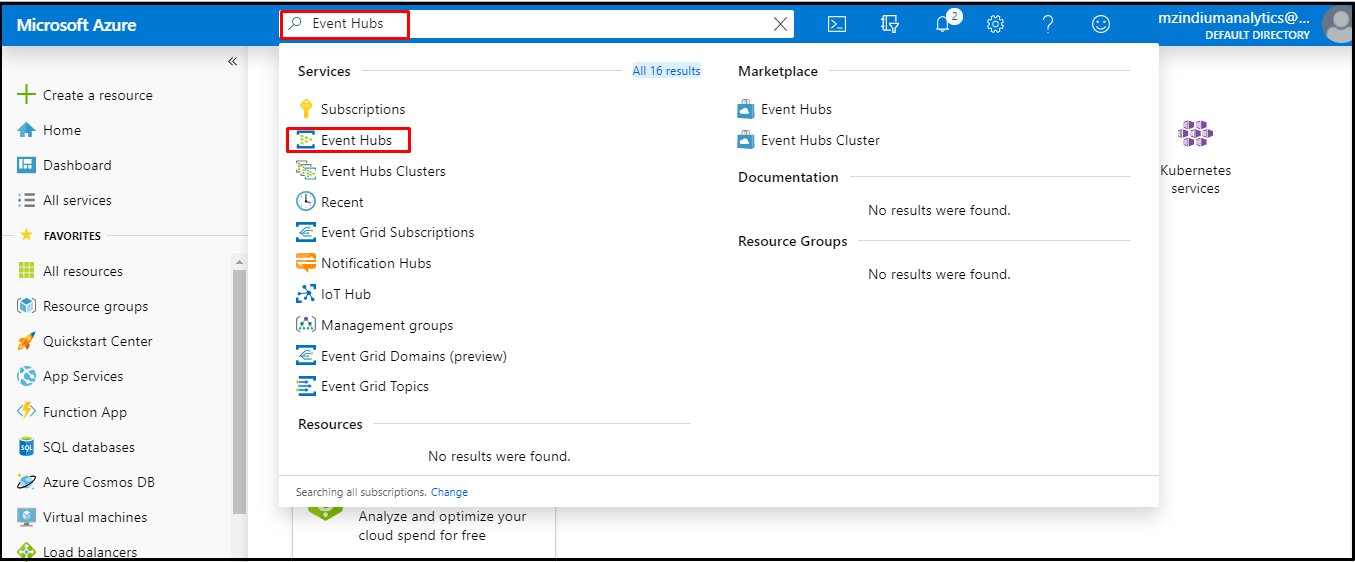
Search for Event Hubs in the search text box and select it.
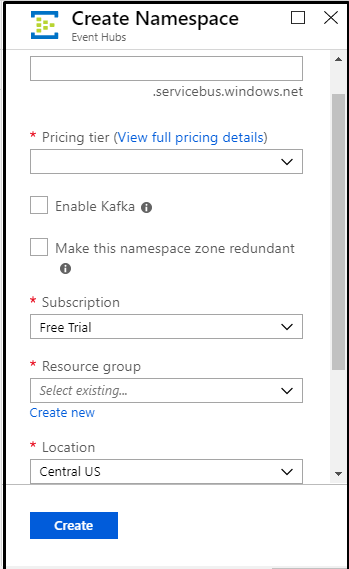
Once you are into it, click on ’Add’ to create your name space, give any name to it of your desire and choose the corresponding resource and the same location which we used earlier for creating stream analytics job. Then create your namespace.
Step 4: Create job input and output
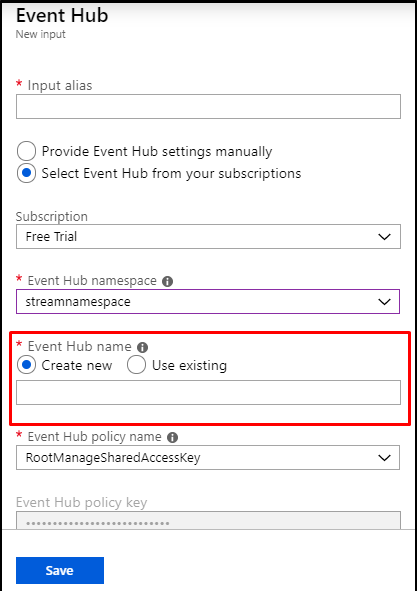
Now we need to add input and output to our stream analytics job. This can be done as follows Navigate to stream Analytics job that you have created and tap ‘Input’ and click on ‘Add stream input’ and select ‘Event Hub’.

In the ‘Input alias’ input box give a name to your input and select the namespace that you would have created using the previous procedure. In the ‘Event Hub name ‘ select ‘Create new ‘option and give any desirable name for your Event Hub and leave the rest as it is and select the save option.
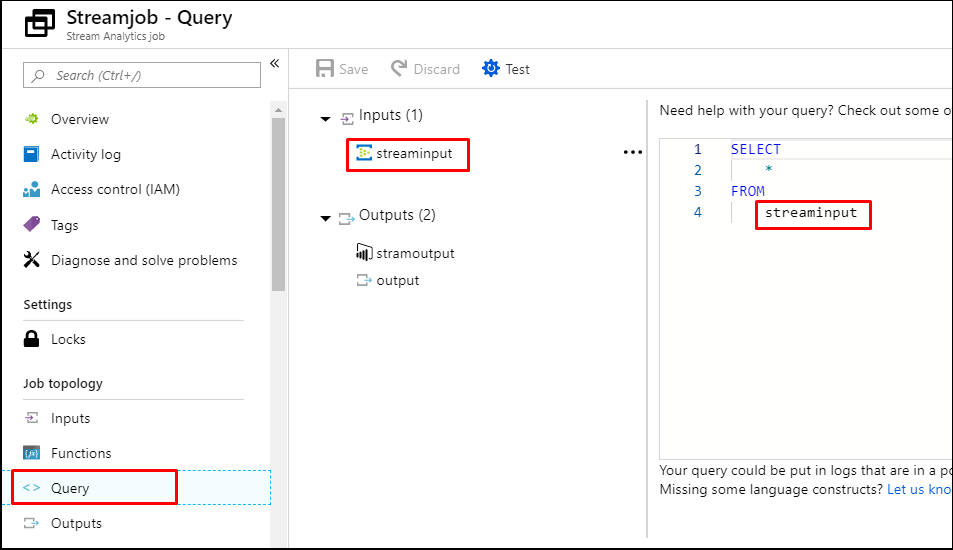
Moving further, we have to query our data which will help to stream the data to our desirable application. Select ‘Query’ and under this you can specify which data has to be portrayed to your output application. In our Example we will be doing a “Select * from [Input alias name] “and then save.
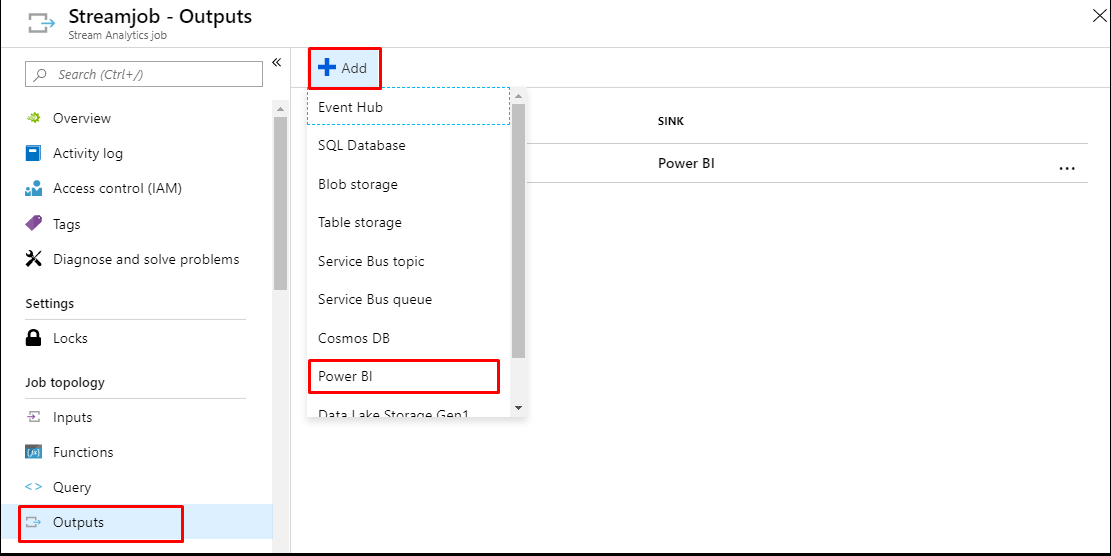
Select ’Output’ and choose ‘Power BI’ by clicking on the add option. Give a name of your wish to the ‘Output alias name’ and provide the Dataset and Table name as per your desire which will be visible on the ‘tables’ pane of Power BI. Authorize your Power BI Pro account using your credentials and then click on save button to complete our setup.

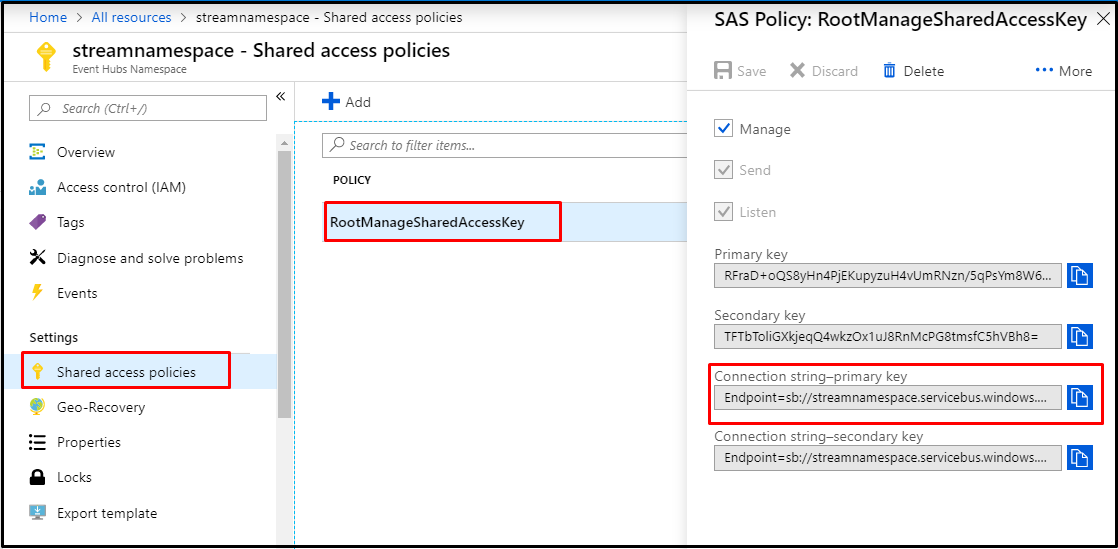
Step 5: Extracting connection string to connect Event Hub to data source – Python in this case
We now need to establish a connection between Azure stream job and Python module generating real-time data.
Navigate to ‘All resources’ Name of namespace you created recently ’Shared access policies’ and select ‘Root Manager Shared Access Key’ from that.Copy the ‘Connection string primary key’. This connection string will be used in the python code to stream data into our Job.
Step 6: Data generation in Python
Python is the most versatile and easy-to-code coding language out there for a variety of purposes. It is a must know for all things data.
This Python code generates transactions data for supermarket store which would be used as the main source of data. You can access the Python code through Data_generation.py. The code creates a supermarket data which generates eight columns.
The connection string extracted from Azure should be used in your code. The process to use the connection string is explained in the codes itself.
import pandas as pd
import numpy as np
import json
import random
from time import time, sleep
from datetime import datetime,timedelta
"""
Install Azure Service Bus Client in Python
pip install azure-servicebus
"""
"""
For Python 3 use the below command to import the Azure service bus
from azure.servicebus.control_client import ServiceBusService
"""
from azure.servicebus import ServiceBusService #For Python 2
# Establishing Connection with Event Hub
sbs = ServiceBusService(service_namespace='Your Created Namespace', shared_access_key_name='RootManageSharedAccessKey', shared_access_key_value='Extracted Key from Connection String'')
shop_items=['Noodles','Flour','Rice','Pancake Mix','Toilet Soap','Ball Pen','Shampoo','Olive Oil','Banana','Pomegranate','Marshmallows','Tropicana','Hair Oil','Room Freshener','Deodorant','Incense Sticks','Coffee Beans','Chamonile Tea','Marker','Napkins']
payment = ['Cash','Debit Card','Credit Card','PayTm']
tr_data={}
df_final=pd.DataFrame()
count = 0
for j in range(1,20000):
count = count +1
print(count)
df=pd.DataFrame()
for i in range(random.randint(1,20)):
tr_data_i={}
tr_data_i['cust_id']=j
tr_data_i['item']=random.choice(shop_items)
tr_data_i['units']=random.randint(1,10)
tr_data_i['unit_price']=np.random.normal(75,30,1)
tr_data_i['hour_of_day']=np.random.normal(15,2.5,1)
tr_data_i['payment_method'] = random.choice(payment)
tr_data_i['cost_price'] = np.random.normal(50,10,1)
for k in str(random.randint(1,30)):
k = int(k)
tr_data_i['Date'] = (datetime.today() — timedelta(days=k)).strftime('%Y-%m-%d')
break
data3 = tr_data_i
data3['unit_price'] = float(data3['unit_price'])
data3['cost_price'] = float(data3['cost_price'])
data3['hour_of_day'] = float(data3['hour_of_day'])
# Sends the data to Event Hub
sbs.send_event('Youe created Event Hub Name', data3)
Step 7: Create Real time Dashboard in Power BI:
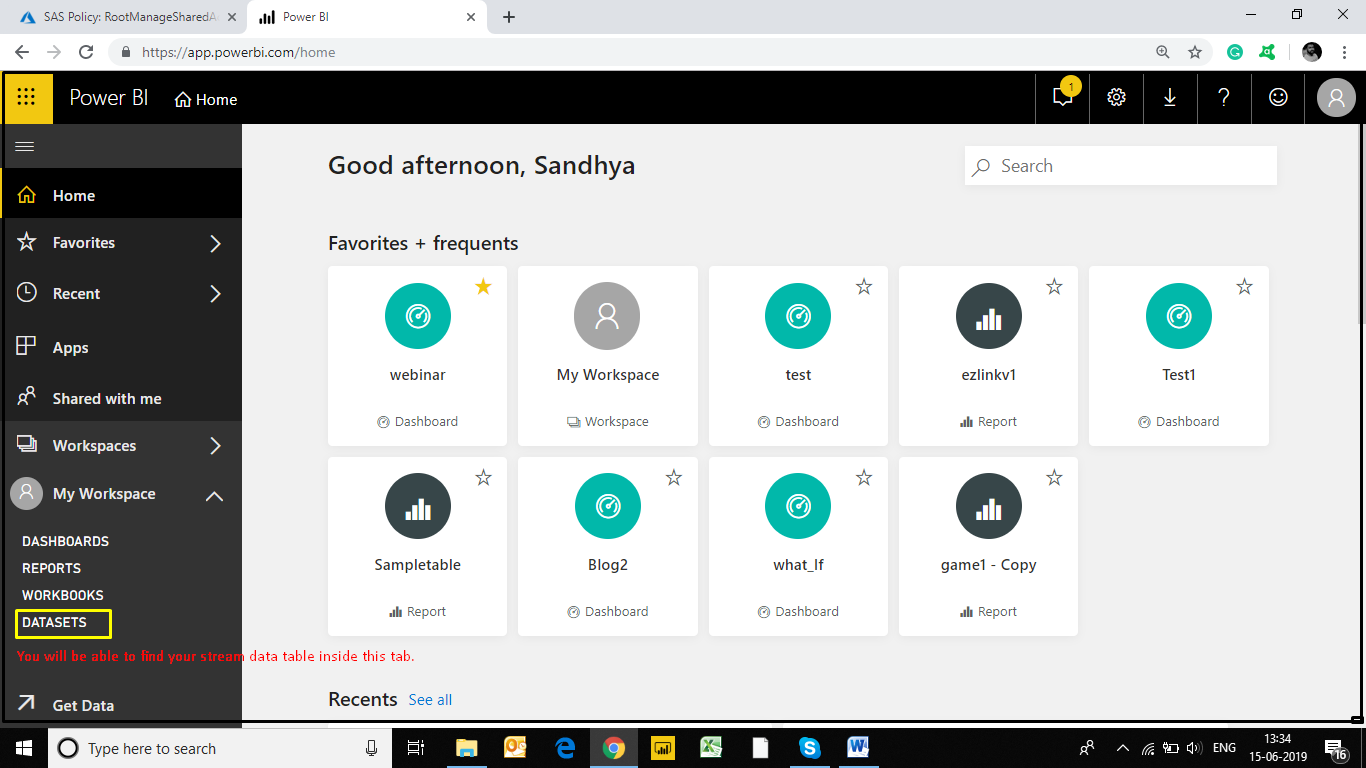
Now we move to step 3. Sign in to your Power bi account from your browser and in the left corner under ‘My Workspace’ we can see 'Datasets' tab in which we will be able to see our streaming data which is live.
Now we can start creating our live dashboard. Tap to 'My Workspace' after that we will be able to see a 'Create' tab on the top right side of your screen. Click on it and select ‘Dashboard’ and give a name it.

Now we are into our dashboard and it’s high time that we start creating some live charts.
Tap on ‘Add tile’ and select ‘Custom Streaming data’ and proceed further.

In the next panel you will be able to see the name of your streaming dataset in it. Select the dataset and proceed further.
Choose the type of visualisation as per your requirement; add variables from your dataset into ‘fields’ box and start exploring the various visualizations provided by Power BI.

Once the graphs are set to its parameters you can start seeing it streaming on your dashboard.
A real time dashboard in Power BI, doesn’t it looks cool and lively. Below you can find a sample of a real time dashboard that we have created.
Please note that the Event Hub and Azure Stream Analytics can be replaced by Kafka if an open source tool like R Shiny, Javascript etc. is used for creating the dashboard. Power BI works only with the streaming tools in its ecosystem.
Hope this knowledge sharing was useful. We urge you to get your hands dirty and create your own dashboards and obtain meaningful insights from it. We look forward to hear your feedback and help you if you have any queries. Happy Dashboarding or should we say Happy Streaming!
Author:-
Kirthi Tej is a data analyst at Indium software. He has a year of experience in data visualization and is extremely interested in machine learning. He loves to travel.