
In one of the previous articles, I’ve already written about the hybrid monitoring system from Monq. Almost two years have passed since then. During this time, Monq has significantly updated its functionality, a free version has appeared, and the licensing policy has been updated. If monitoring systems in your company start to get out of control, and their number rushes somewhere beyond the horizon, we suggest you take a look at Monq to take control of monitoring. Welcome under the cut.
Licensing has become more flexible
I’d like to start the review with good news — the appearance of a free version of the solution. In the new version of the licensing policy, the previous monolithic Monq was divided into three subproducts, each one with an individual license:
- Collector — collection and analysis of logs,
- AIOps — hybrid monitoring and incident management,
- TestForge — functional testing of information systems and services.
You could eagerly download Monq Collector for free from the vendor's website. Later in the article, you could learn how to use it. AIOps and TestForge are provided in the extended version of the product and licensed according to the number of configuration units and to the number of runs of test scripts per day, respectively.
Simplified installation
Since the last publication of the article in 2019, the Monq deployment procedure has undergone many changes. First, the architecture of the deployed solution now doesn’t com-prise four servers but only one. Secondly, now the administrator has no need to manually prepare the infrastructure, install Kubernetes, run playbooks, and stuff. From now on, the product is delivered in the form of a virtual machine image, which can be simply imported into the virtualization environment, connected to the console, and assigned network settings that provide name resolution and Internet access. All other actions are performed in the graphical interface.
The IP address set on the virtual machine, you can go to the RUNDECK web interface.
In this video, you can see the taken steps. There are three scenarios available for the administrator:
- infra install — it’s executed in the first place, the script will install all the necessary infrastructure services.
- monq install — the script is run after the infrastructure’s prepared. This will install the components. We run the Monq install script, that will install all the microservices of the system.
- monq erase — the script is optional to run, we need it in non-standard cases when you cry for removing the application software.
The final point of installation is the issuance of a login and password to enter the platform.
Operation became easier and new possibilities appeared
Updated interface
After logging into the system, as before, the sections «Workgroups» and «Users» require configuration. You need as well to configure the mail plugin: specify the mail server, username, and password. Newly created users will not receive their generated passwords without this setting.
The old graphical interfaces of workgroups and users have changed likewise: the UI has changed, which is now based on Angular. Several screens are still on the same front (VueJS), but as the vendor says, they will soon be a thing of the past ditto.
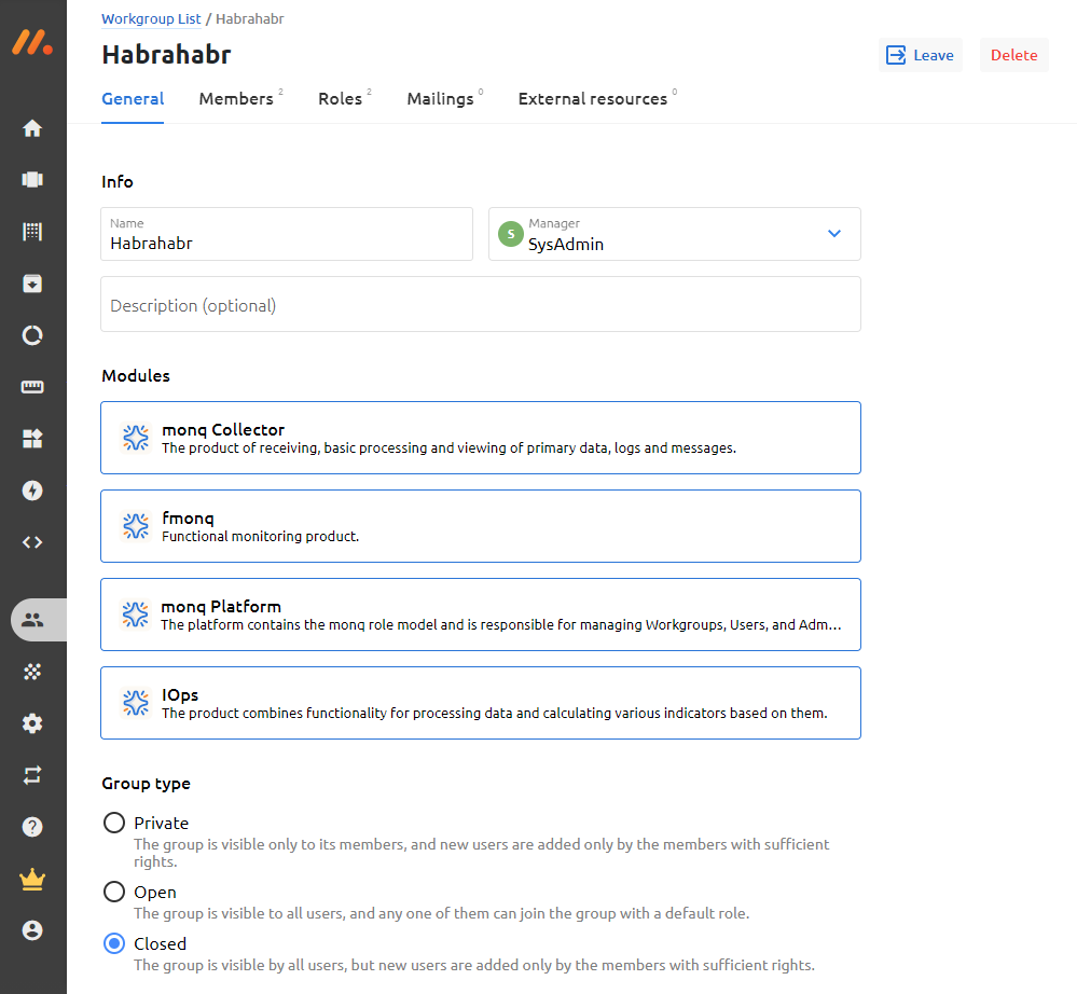
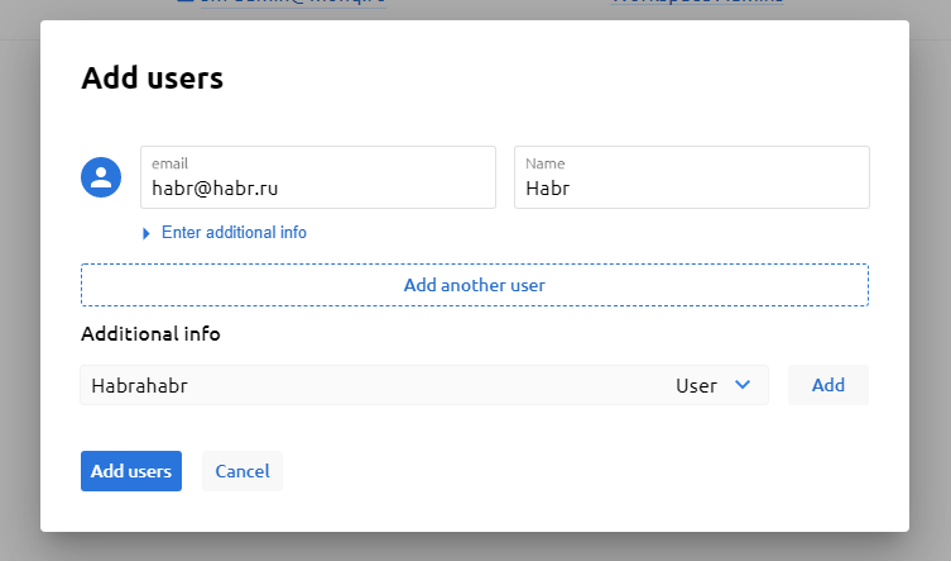
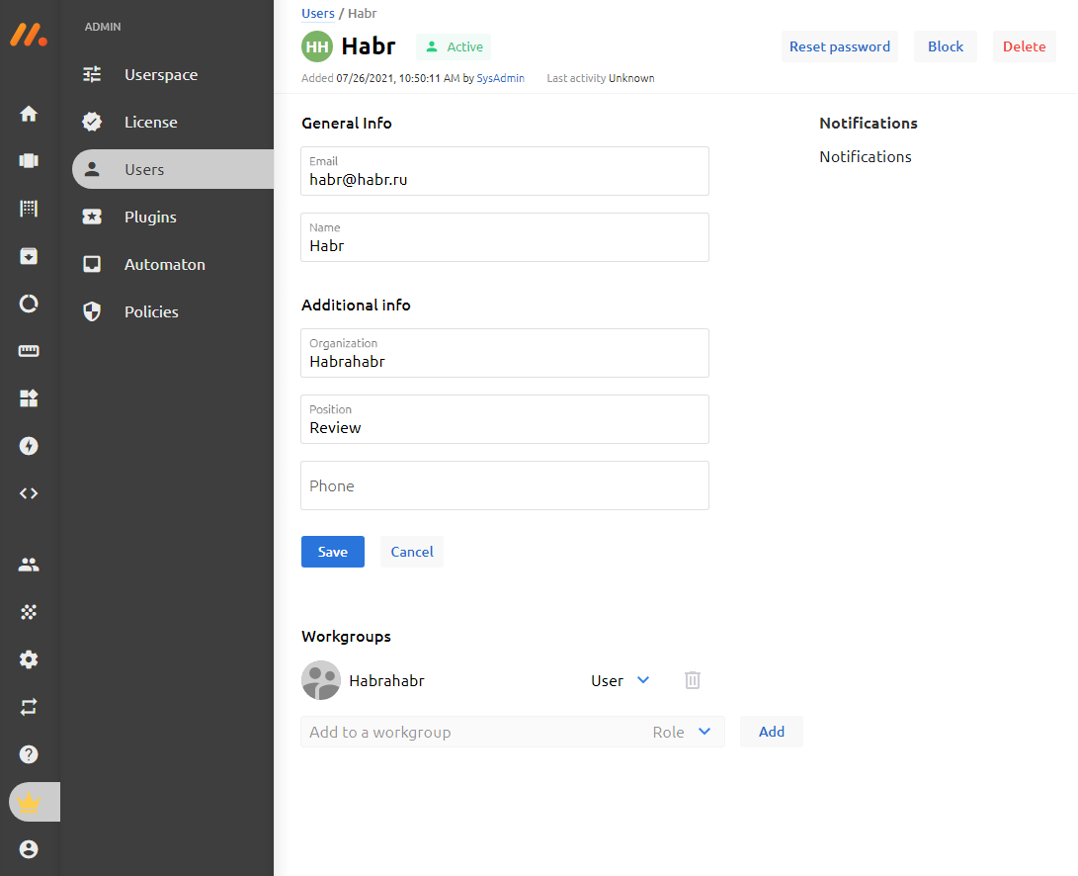
For demonstration purposes, I created a workgroup called «Habrahabr» and a user called «Habr» in the monq space for further work.
In the workgroups, there were not only interface changes but also functional ones. Let's try to figure out what new features the vendor has added.
A section for managing workgroup policies has been added to the administrative panel. In a specific case, the policies are global for the space for setting up workgroup management capabilities for ordinary users. While administrators still have access to any changes, for ordinary users, the ability to create or delete groups is determined by policies.
The platform user can now have several different roles in the same group at the same time. This makes it possible to configure user access rights more flexibly to various objects and functions of the system. Instead of the “Public group” mark, the following types of privacy for working groups have been introduced:
- Public — visible to all users, users can join the group themselves,
- Closed — visible to all users, users on their own cannot join the group,
- Private — groups are visible only to members of these groups.
The user section, consisting of the user profile and the platform user management page, was also transferred to Angular, while retaining all the previous functionality, but there were also improvements. Now available:
- mass addition of users,
- adding a user to a workgroup upon creation,
- notifying the user by email about registration, blocking, unblocking,
- viewing notifications the user is subscribed to,
- management of teams and teams and roles from the user page.
The interface is now available in two languages: Russian and English.
Resource-service models (RSM) are updated
The RSM configuration has been rethought practically from scratch. However, all functionality has been retained.
Here are screenshots of the RSM panel interface:
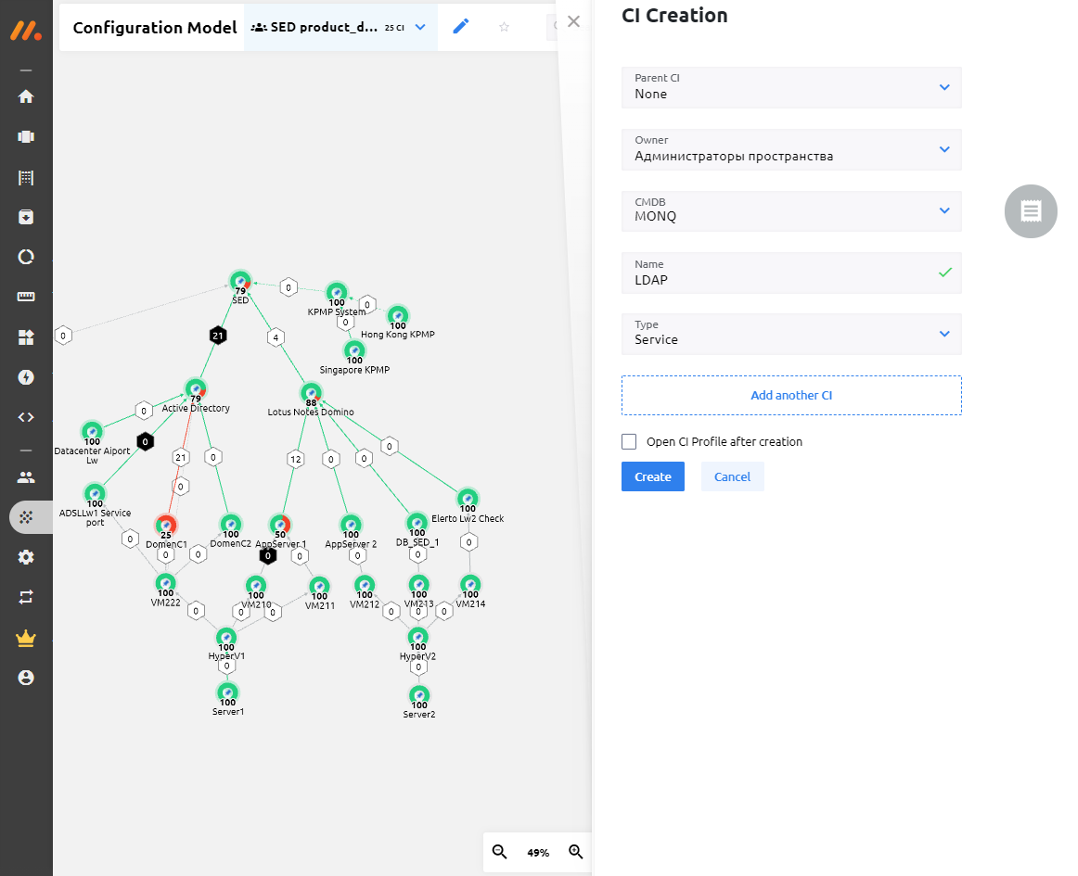
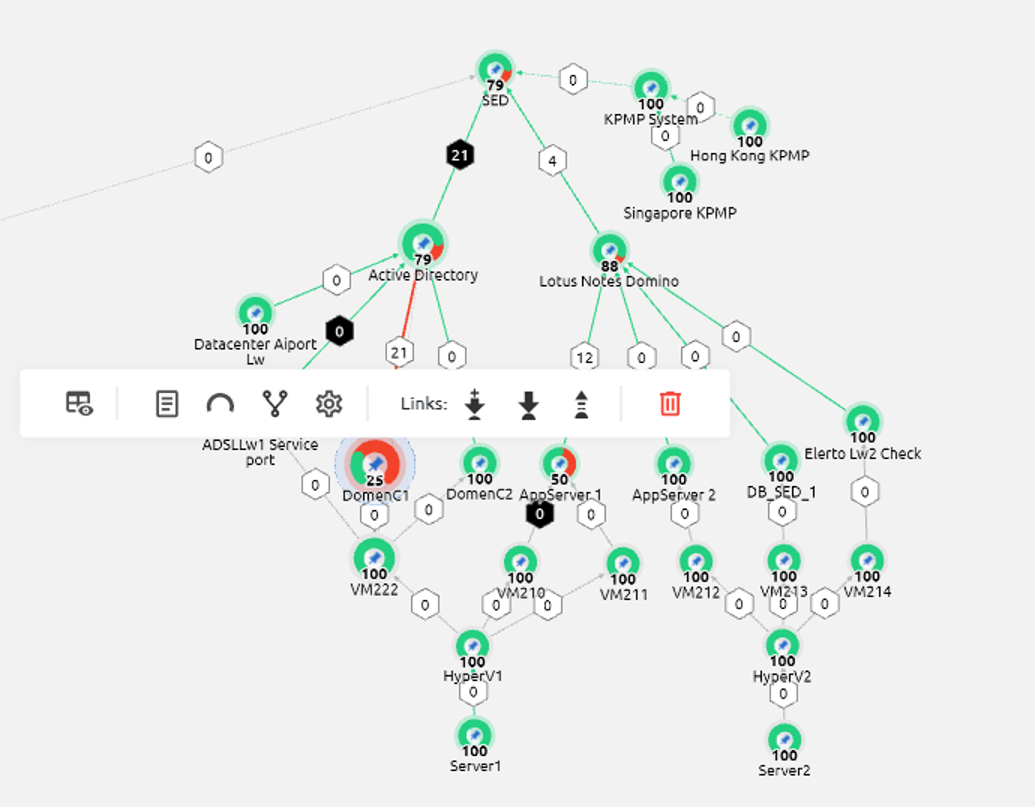
Creating influence and dependence links, as well as deleting and viewing basic data on CIs are performed from a pop-up menu. For example, the state of health of one of the CIs:
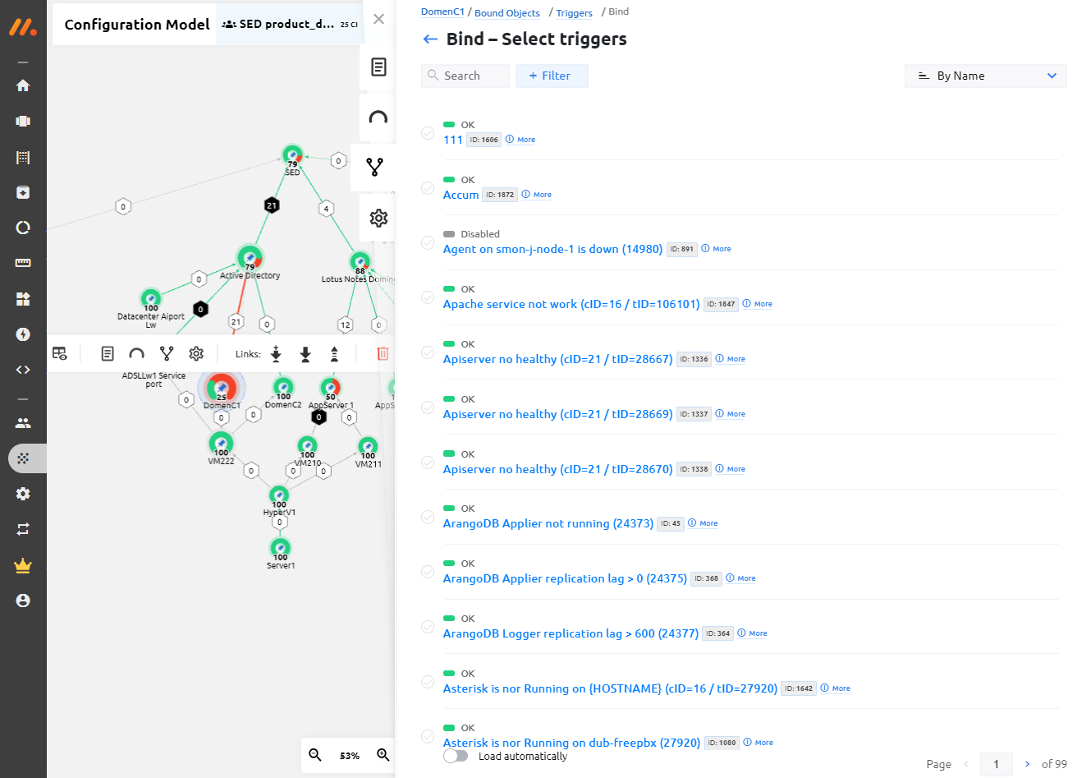
In order to bind triggers to a particular CI, you need to open the panel with related triggers and select the necessary ones:
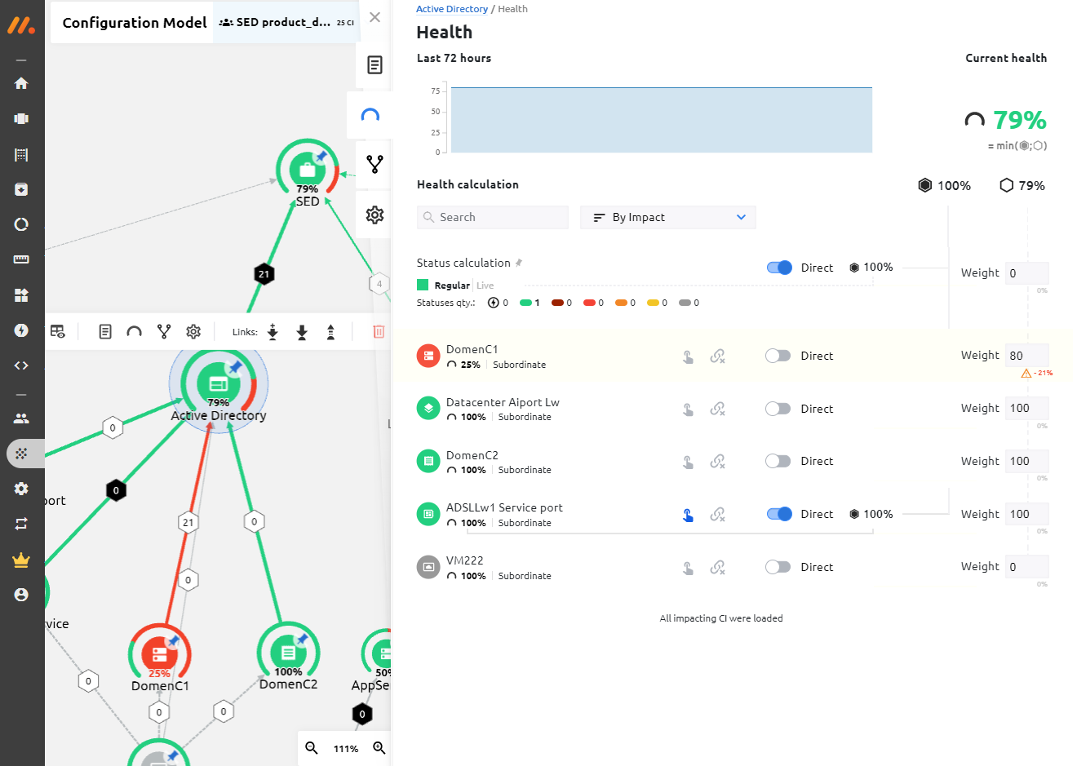
The new panel gives the opportunity to work with such a parameter of CI as its health. This parameter is a composite one and, first of all, it serves to visually assess the state of the RSM. The user can clearly see which CI has the most serious effect on the health of the problematic CI, based on the value of its negative impact coefficient. Here is an example of the CI health panel:
Updates for integration settings
In the 6th version of the Monq, the overview of which I demonstrate here, a significant modification has been made to the module of integration with external systems. From the time when the first article was written, the interface of the integration module also, like many other screens, was moved to Angular.
«Integration type» was transformed into «configuration template», and the integrations themselves were redefined as data streams.
The following system templates for the configuration of data streams are available from the box: Zabbix, MS SCOM, Prometheus, Ntopng, Nagios.
Integration with other monitoring and logging systems can be done through the «AnyStream» configuration template. Starting with version 6.0 you can write your own handlers where you can parse the RAW stream into JSON and enrich the resulting events with customized labels.
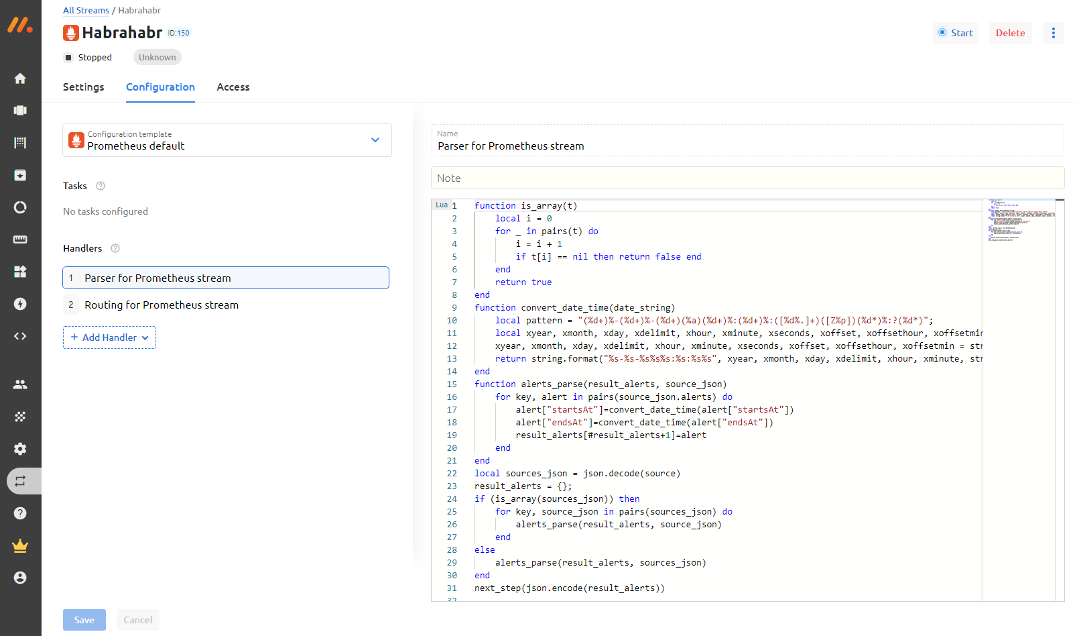
The screenshot below shows a parser of incoming events from Prometheus that converts the date format:
A free version for analyzing logs is now available
Logs Screen is the main tool of the free version for analyzing logs. This module appeared about a year ago. The plug-ins subsystem has become available to users in the same release. Plugins allow you to collect data from various sources.
The main goal of the screen of primary events is to provide users with a tool for visualization and centralized search, analysis, and processing of logs stored in the ClickHouse database.

Let's try to figure out how to use this tool.
At the top of the screen, there is a search bar in which the native MQL syntax is used that outwardly is somewhat similar to Lucene. I‘ll give examples of search queries taken from the vendor's website.
| Type of query | Example | Comments |
| Search by term (exact match, no special characters) | stream.name:Messages |
The query is not case sensitive. |
| Search by phrase with spaces, numeric, negative values, dates (exact match) | _stream.name:"CIT Messages" source.text:"what happened\?" source.text:happened\? |
Escaping is done using quotes. For symbols ? * \ " inside double quotes you have to do internal escaping with \, if you want to find an exact match.Also if there are no escape quotes, but there are characters ? * \ ", they also need to be escaped with \. |
| Value is not equal to | !_stream.name:"CIT Messages" |
|
| Prefix search | _stream.name:Pr* |
The query will return all events which have values of the _stream.name field beginning with "Pr". For example, Prometheus.Query !_stream.name:Pr* — will return events where the value of the _stream.name field does not start with "Pr". |
| Full-text search | _stream.name:*bb* |
The query will return all events where the values of the _stream.name field contain consecutive characters "bb". For example, Zabbix.Symbols can appear anywhere in the value. Query !_stream.name:*bb* will return events that do not contain "bb" in _stream.name.If you are searching using a phrase with spaces, you must enclose it in quotation marks. For example, query _stream.name:"*IT Messag*" will return events in which the _stream.name field contains "IT Messag", as in "CIT Messages". |
| Postfix search | _stream.name:*ges |
The query will return all events where _stream.name field values end with "ges". For example, “messages”.Query !_stream.name:*ges will return events with _stream.name not ending in "ges". |
| BooleanQuery (boolean conditions) | _stream.name:Messages AND (source.Type:UserLeft OR source.Type:UserJoin) |
Expressions can be joined using the OR or AND operators, which are separated by one space on the right and left.A query (also a bracketed expression) cannot start with an operator. The number of operators must be 1 less than the number of expressions. Expressions and operators must be interleaved. Also, expressions can be combined through parentheses, the number of opening and closing parentheses must be the same. Expression precedence as in mathematics, where AND is multiplication, OR is addition. |
| Escaping characters | source.text:"what happened\?" source.text:happened\? source.password:"asd(\\\?) sd" will search for an exact match “asd(\?) sd” |
Parentheses, colons, and spaces must be escaped with double quotes. Also symbols ? * \ " need to be escaped with \. |
| Finding events with a particular field non-empty | source.text:exists() |
Works with any type of field. |
| Exclude events in which a particular field is present | !source.text:exists() |
Works with any type of field |
In addition to search queries, there is an analytical tool that helps to determine the number of unique values for any of the fields and their respective percentages within the rest of the values. All values in primary events are active elements on which you can immediately configure filtering.

New options in settings for monitoring and alerting
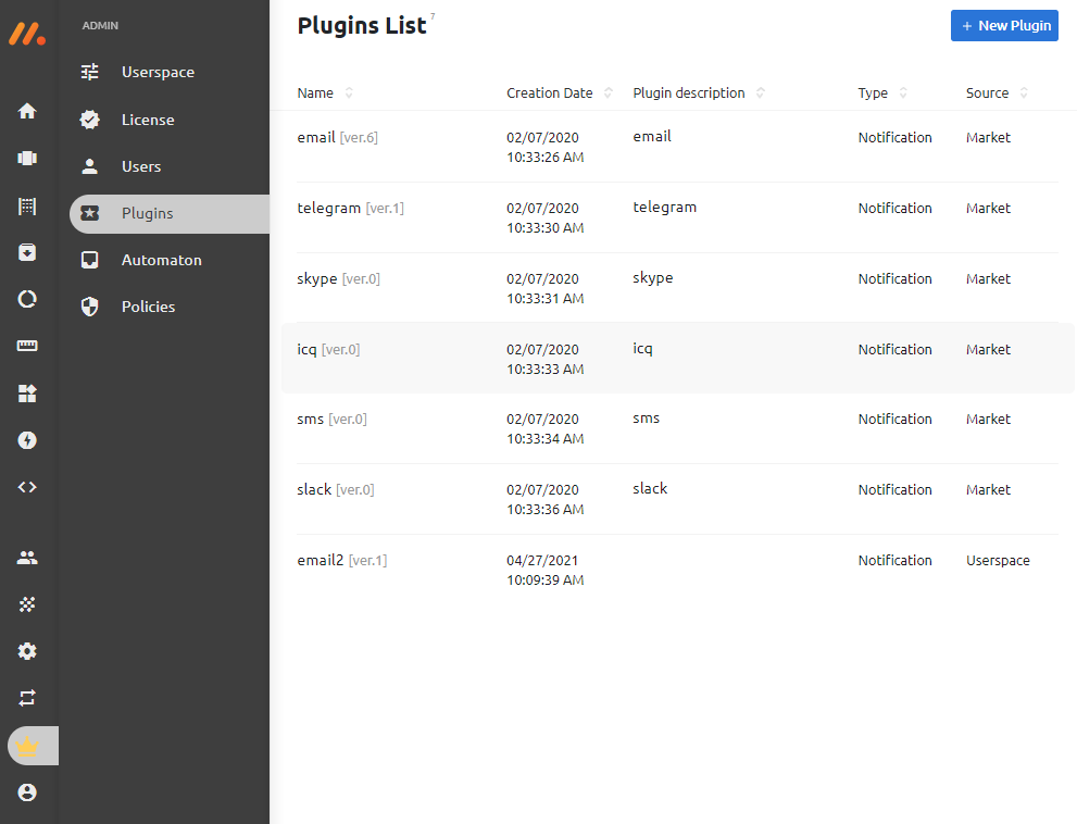
In recent versions of Monq, it is possible to create your own alert plugins. Plugin subsystem allows space administrators to create and add their own notification plugins to the Monq system.
As a reminder, Monq has the ability to create escalation chains with advanced logic.

Availability reports are implemented
Availability reports have replaced SLA reports. This is a completely new tool for calculating the availability of information systems.
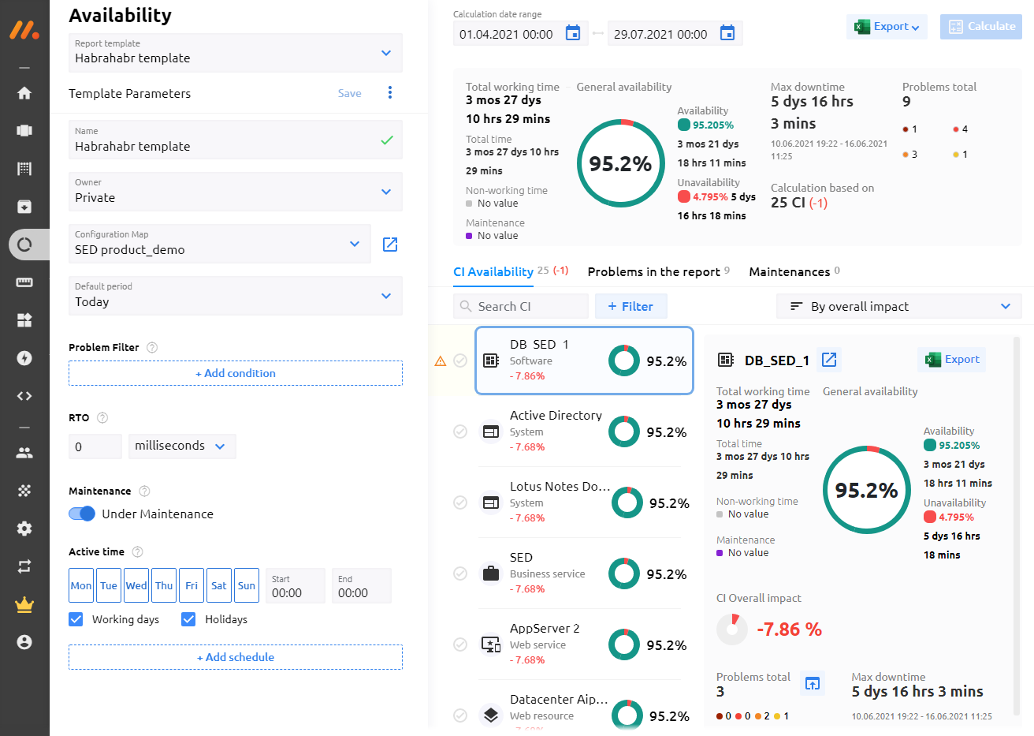
The «Availability» section allows you to:
- Work with availability information of:
- configuration items and their impact on IS availability,
- information systems that consist of a selected number of CIs,
- complex ISs, consisting of many subsystems with the ability to determine the value of the influence for each of them.
- Configure parameters for generating an availability report and save them as a template. The templates for the new report received a wider range of settings:
- Using PCM maps as a filter — to generate a report there is no need to create and update a list of KEs, it is enough to select an already saved PCM map.
- More functional filter for alerts.
- The Recovery Time Objective (RTO) indicator is the maximum time during which a CI can have problem status. This parameter allows you not to take into account unstable statuses of CIs in the calculation.
- Service time (working time) — not to be confused with the service modes for CI, it allows to take into account non-working hours in the calculation in a proper way.
- Manage templates and multi-templates (report templates for complex information systems):
- create personal and group templates,
- edit template parameters,
- delete templates.
- Quickly configure parameters and generate a report using them without saving the template.
More details about the methodology for calculating availability can be found on Habr in this article (in Russian).
Updated module for functional tests (Monq TestForge)
The heading of the article is about AIOps, but I also want to make a brief overview of another important tool for complex business monitoring.
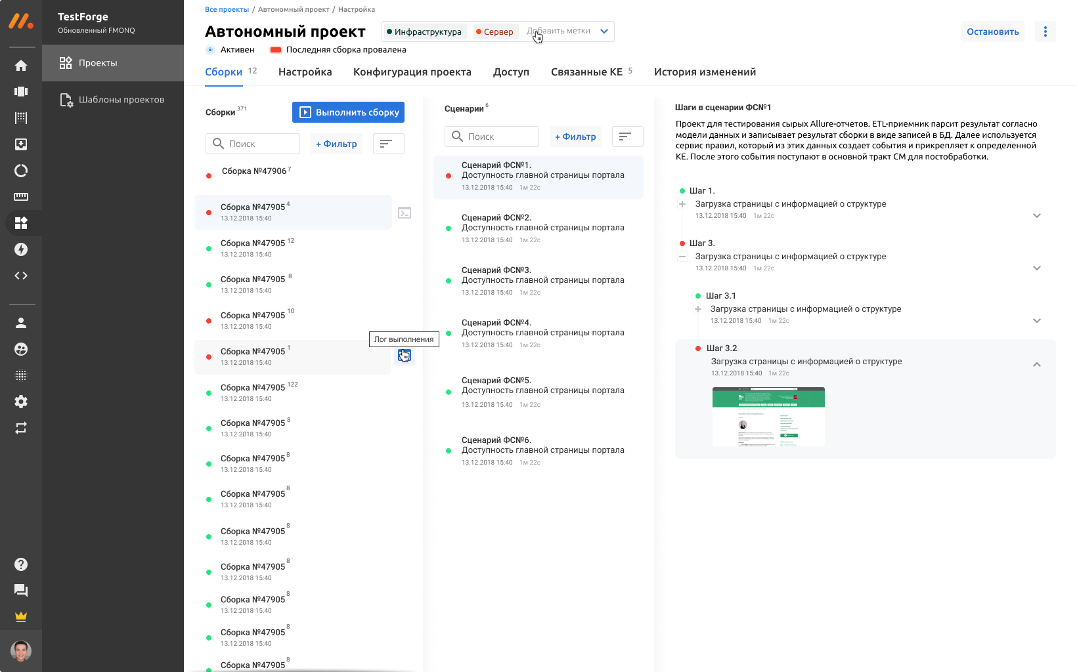
The Monq TestForge product, provided under a separate license, has functionality allowing you to abandon the mandatory use of external systems for configuring and running tests. It also makes it possible managing of projects from a common interface.
There are two types of functional testing projects: managed and stand-alone. Standalone projects are managed from the environment in which they are launched, and managed projects are directly managed by TestForge.
The projects screen is divided into several views:
Project management panel. It lists all the available projects in the system with different labels and a very nice interface.

Configuration templates are provided for the convenience of quickly creating and configuring new managed projects. Templates contain a set of project environment variables and job codes. You can create a new template based on an existing project.
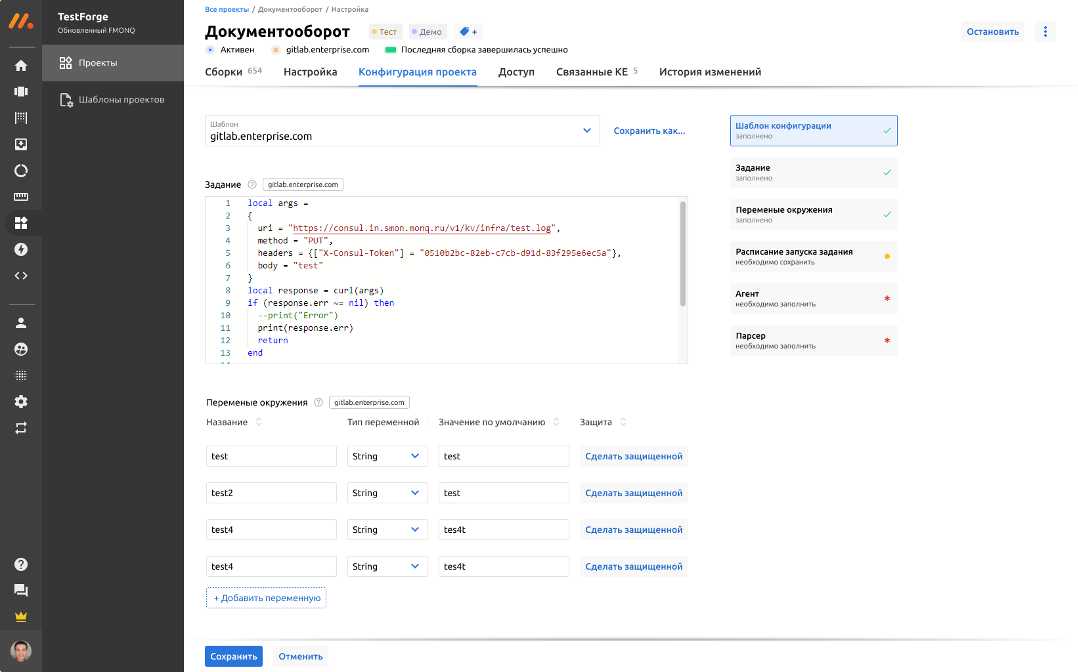
The management of the schedule for running tests looks very good. The scheduler starts the execution of the task code based on:
- the general timetable and the results of the previous task execution,
- user actions: execute now or execute at a specific time.

History of builds. For managed projects it is possible to manually start the build with additional features:
- the setting of startup variables,
- viewing the test execution log.
- viewing the broadcast of the test execution in real-time.
Agents and coordinators of agents are introduced in Monq
In 2021, the system expanded its presence with agents. Agents are installed on systems running Linux or Windows and is able to:
- get information about the system and transfer it to the data stream,
- tail the log file and send raw data to the data stream,
- tail the log file, parse it and send JSON to the data stream,
- run TestForge scripts and send the execution result to the TestForge preprocessor,
- fetch data from PostgreSQL without permanently establishing a connection and send it to the data stream,
- forward messages from brokers (RabbitMQ, Kafka) to the data stream,
- connect to Zabbix database and check for changes in triggers.
From the side of the platform, agents' work is managed and monitored by agent coordinators. An agent processes a set of tasks coming from a coordinator and generates outputs and the execution log.
There are two types of agents in Monq:
- static — agents monitored by the system,
- dynamic — agents whose state is not monitored by the system.
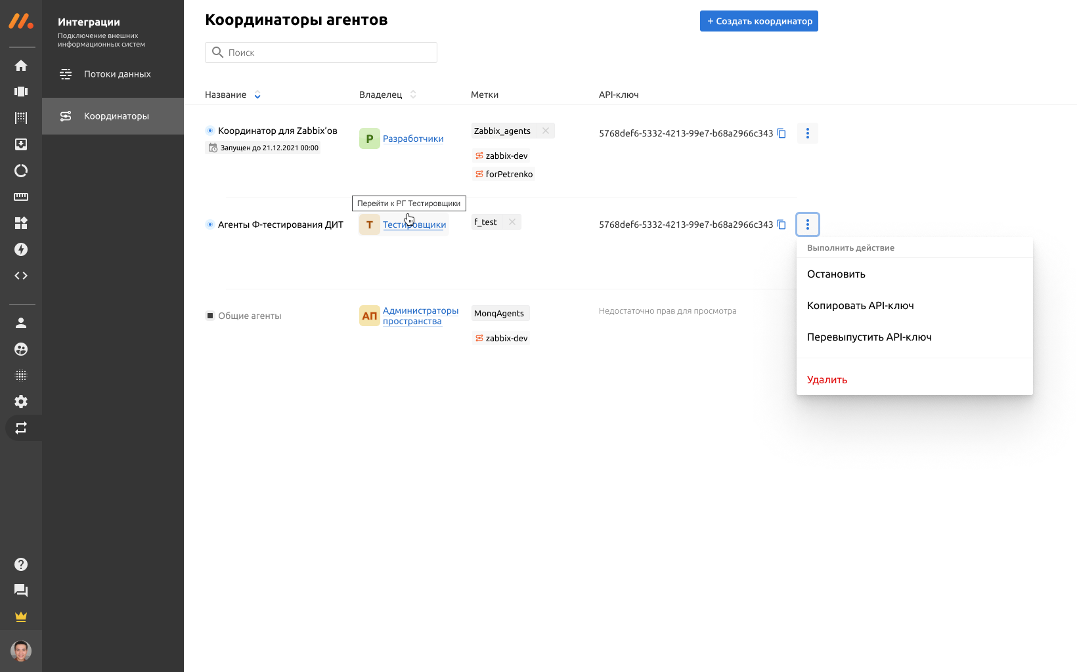
Agent coordinators are responsible for identifying agents in the system and configuring access to information received from the agents.
By managing the coordinators you can:
- create or remove a coordinator,
- stop or start the coordinator,
- configure access rights to the coordinator,
- re-issue a token for connecting agents,
- add or remove labels for agents,
- configure coordinator parameters.
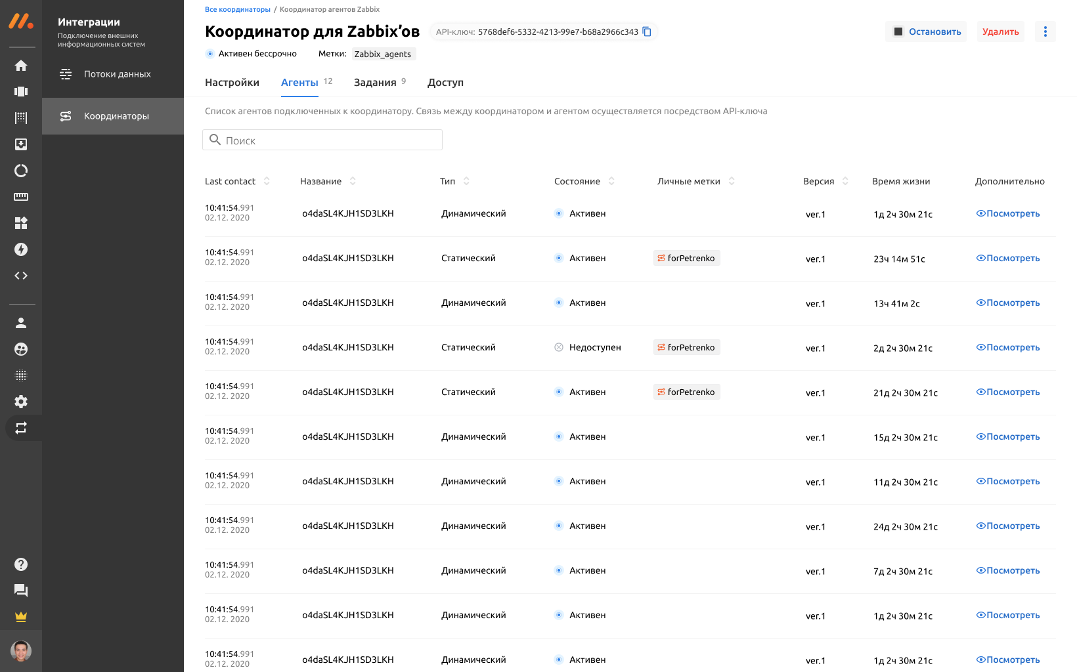
The list of connected agents is presented with the following information:
- agent type (static or dynamic),
- agent name,
- agent state,
- labels,
- the version of the installed agent,
- the agent's task execution log,
- date and time of the last processed job,
- technical data of the agent.
Conclusions
In this article, we talked about the new and updated features of the Monq hybrid monitoring AIOps system. The product is in continuous development and in the near future, we’ll receive many new improvements. You can follow the updates on the vendor's website, as well as subscribe to a special telegram channel.
It should be noted that Monq is not limited to integrations with Zabbix, MS SCOM, Prometheus, Ntopng, and Nagios. If necessary, it is possible to develop your own integration modules and take data or events from somewhere else.
If you would like to test the solution in your environment or get trial licenses, please leave your data in the feedback form on our website or contact us in any other convenient way.