
Not so long ago, a landmark event has happened: PVS-Studio appeared in Compiler Explorer! Now you can quickly and easily analyze the code for errors right on the godbolt.org site (Compiler Explorer). This feature opens up a large number of new possibilities – from quenching curiosity about the analyzer's abilities to being able to quickly share check results with a friend. This article will cover the topic on how to use these features. Caution – large GIFs!
If you want to get right to the point and analyze the code here and now, here is a fully ready-to-use link. I recommend adding it to your favourites – it will come in handy ;)
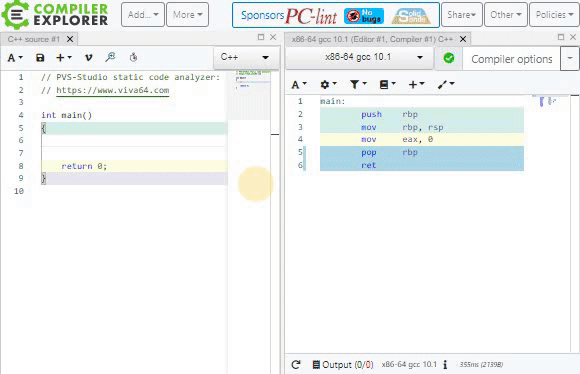
But first things first. Compiler Explorer is an interactive online service for researching compilers. Here you can write code directly on the site and immediately see what assembly output a particular compiler will generate for it:
In addition, the site has a whole set of features. Today we will consider the analysis using PVS-Studio. In order to perform the analysis, you need to do the following:
- Go to the site godbolt.org,
- In the tab with the compiler output, click "Add tool...",
- Select "PVS-Studio" from the drop-down list.
You can see an example of this sequence of actions in the animation below:
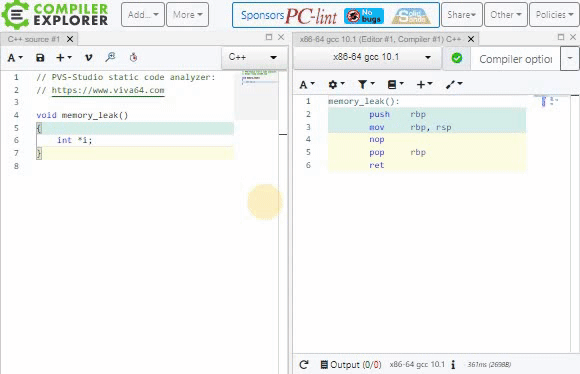
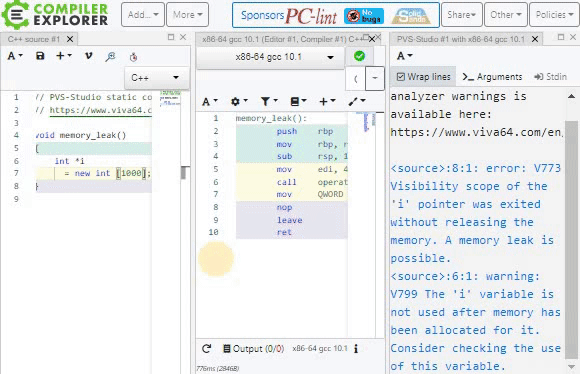
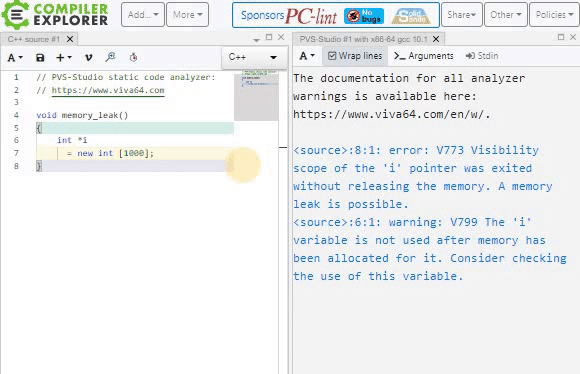
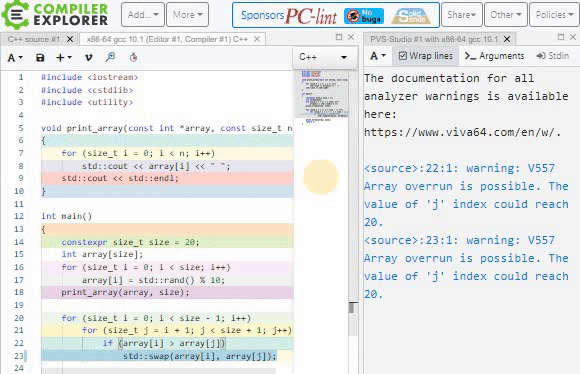
Done! Now the window that appears will automatically display all the warnings that the analyzer issues to your code. You can analyze both manually written code and the source files that you upload separately. Obviously, the files must be self-contained and mustn't use include on files that aren't included in the standard library. Otherwise, the file can't be compiled or checked.
Currently, analysis using PVS-Studio is available on the site for all versions of GCC and Clang for x86 and x64 platforms. We plan to expand the site's capabilities to other compilers that we support (for example, MSVC or compilers for ARM), if there is demand for this.
Currently, only general diagnostics of the error, warning, and note levels are enabled on the site. We intentionally didn't include other modes (Optimization, 64-bit, Custom, and MISRA), so that only the most important warnings remain in the output. Also, unlike PVS-Studio itself, Compiler Explorer doesn't support C# and Java yet. We plan to support code analysis in these languages as soon as they appear there :)
Compiler Explorer has a very smart window system, so you can move them or, for example, overlap them. If you aren't interested in the compiler output right now, you can hide it in the following way:
You can either write code directly in the Compiler Explorer window, or upload individual files. To do this, click "Save/Load" and select "File system" in the opening tab. You can also "download" the code you wrote to your computer by pressing Ctrl + S.
You can't analyze entire projects on the site – you can only upload files individually.
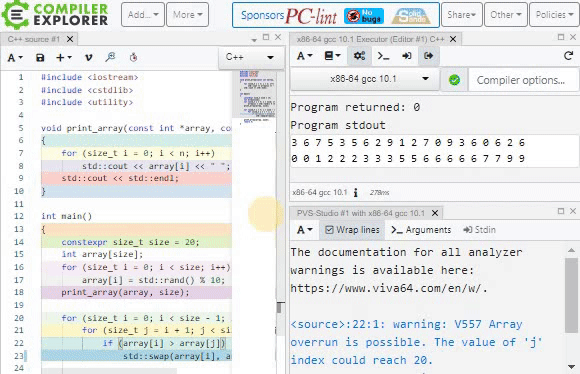
If you want to see the output of your program, you can open the execution window by clicking "Add new… — > Execution only" in the code editor (not in the compiler window). In the gif below, you can see the output of the lab work taken from our page about free usage of PVS-Studio by students and teachers.
By the way, have you noticed that when you click the links at godbolt, you open pre-entered code in pre-arranged Windows? Yes, you can generate permanent links that completely preserve the page state at the time of generation! To do this, you need to click on the "Share" button in the upper-right corner of the screen.
This method is very convenient for sharing the results of compiling/analyzing your code with friends and colleagues. It is especially convenient that the receiving party literally doesn't need to do anything: just click on the link, and everything you need will immediately open before your eyes.
We plan to use this feature when chatting with our clients in technical support. Often Compiler Explorer usage is very convenient for creating minimally reproducible examples that can be quickly picked up and sent by mail.
Also, in the "Share" drop-down tab, there is an option to create an Embedded link, which can be used to embed the window with Compiler Explorer into another site.
Compiler Explorer always contains the latest version of PVS-Studio, so after each of our releases, you will find more and more errors on the site. However, PVS-Studio usage at godbolt.org doesn't give a comprehensive understanding of its capabilities, because PVS-Studio isn't only a tool, but also a developed infrastructure:
- Analysis of code in C, C++, C#, and Java for a much greater number of platforms and compilers;
- Plugins for Visual Studio 2010-2019, JetBrains Rider, IntelliJ IDEA;
- Integration with TeamCity, PlatformIO, Azure DevOps, Travis CI, CircleCI, GitLab CI/CD, Jenkins, SonarQube, etc.
- Compilation monitoring utility for performing analysis independently of the IDE or build system;
- And much, much more.
After all, only by downloading the analyzer can you fully analyze a project consisting of several files. Therefore, the best way to get proper understanding of PVS-Studio is to download the analyzer and try it on your project.
Follow our news to always keep up to date. Also read our blog: there we post not only news and articles about finding bugs in real projects, but also various interesting points related to C, C++, C#, and Java.
Our social networks:
- Twitter: @pvs_studio
- Facebook — @StaticCodeAnalyzer
- Telegram — PVS-Studio
