We don't often get the chance to write something on parallel programming issues. This time we "got lucky". The TraceEvent standard method has some implementation peculiarities. They resulted in an error with multiple threads blocking. So we'd like to warn users about this nuance and cover this interesting case from our users support practice. Why was our support involved? Keep reading to find out. Enjoy the reading!

Backstory
The PVS-Studio distribution includes the CLMonitor.exe utility or compilation monitoring system. It helps to seamlessly integrate PVS-Studio static analysis for C and C++ into any build system. A build system has to use one of the compilers supported by PVS-Studio to build files. For example: gcc, clang, cl, others.
The standard scenario for this Windows utility is very simple - only 3 steps:
Run 'CLMonitor.exe monitor';
Build the project;
Run 'CLMonitor.exe analyze'.
The first step runs a 'server' that monitors all compiler processes in the system until the server is stopped. Once we've started the server — we build the project we want to analyze. If the build is successful, we need to run the analysis. To do this, we go to the third step. 'CLMonitor.exe analyze' runs a 'client' that tells the server, "That's it, shut down and give us the process monitoring results here". At this point, the server must complete its work and the client will start the analysis. Later you'll learn some insights of how the monitoring system operates, how the server collects processes.
So one fine day the scenario above didn't work - the analysis just didn't start. What's more, it wasn't us who had this problem, but a user who contacted our support. Here's what was happening. The analysis ran, the server wasn't responding for ten minutes, the program exited by timeout. The reason for this was a mystery. We couldn't reproduce the problem. A double-trouble! We had to request a dump file for our utility process to see what was going on inside there.
Note. The user had a problem when using the CLMonitor.exe Windows utility. Therefore, all further examples will be relevant for Windows.
How CLMonitor.exe Works
Don't skip this part - it will help you understand my further reasoning on the user's problem. Let me tell you how the client and server interact.
All the source code you see here was taken from a mini project simulating the operation of the utility. I wrote it especially for you to make the case more clear. All source code is given at the end of the article.
Why Do We Even Catch Processes?
The story starts with having to run a server that will catch all processes. We do it for a reason. A more convenient way to analyze a C++ project is to directly run the analyzer through the PVS-Studio_Cmd command line utility. Yet it has a significant constraint - it can only check projects for Visual Studio. You have to call a compiler so that it processes source files being checked. After all, the analyzer works with preprocessed files. In turn, to call a preprocessor, you need to know:
which compiler to call;
which file to preprocess;
preprocessing parameters.
The PVS-Studio_CMD utility learns everything we need from the project file (*.vcxproj). However, this only works for "regular" MSBuild Visual Studio projects. We can't get the information the analyzer needs even for NMake projects. It is because the information is not stored in the project file itself. And that's despite the fact that* NMake* is also .vcxproj. The project itself is kind of a wrapper for another build system. That's where all sorts of smarts come into play. As for analysis of Unreal Engine projects, we use direct integration with *Unreal Build Tool * - a build system used under the hood. Read more here.
CLMonitor.exe lets us use PVS-Studio regardless of a build system—it can be even the most exotic one. It monitors all processes during project builds and catches compiler calls. Then we get all the information we need for further preprocessing and analysis from compiler calls. Now you know why we need to monitor processes.
How the Client Runs the Analysis
We use the WCF (Windows Communication Foundation) software framework to share data between the server and client. Let me briefly describe how we work with it.
The ServiceHost class creates a named channel that will exchange messages between client and server processes. Here's what it looks like on the server side:
static ErrorLevels PerformMonitoring(....)
{
  using (ServiceHost host = new ServiceHost(
                       typeof(CLMonitoringContract),
                       new Uri[]{new Uri(PipeCredentials.PipeRoot)}))
  {
    ....
    host.AddServiceEndpoint(typeof(ICLMonitoringContract),
                            pipe,
                            PipeCredentials.PipeName);
    host.Open();
    ....
  }
}
Notice two things here:* ClMonitoringContact and IclMonitoringContact*.
IClMonitoringContract is a service contract. ClMonitoringContract is the implementation of a service contract. It looks as follows:
[ServiceContract(SessionMode = SessionMode.Required,
                 CallbackContract = typeof(ICLMonitoringContractCallback))]
interface ICLMonitoringContract
{
  [OperationContract]
  void StopMonitoring(string dumpPath = null);
}

[ServiceBehavior(InstanceContextMode = InstanceContextMode.Single)]
class CLMonitoringContract : ICLMonitoringContract
{
  public void StopMonitoring(string dumpPath = null)
  {
    ....
    CLMonitoringServer.CompilerMonitor.StopMonitoring(dumpPath);
  }
}
When we start the client, we need to stop the server and get all necessary data from it. This interface helps us do this. Here's what a client-side server stop looks like:
public void FinishMonitor()
{
  CLMonitoringContractCallback callback = new CLMonitoringContractCallback();
  var pipeFactory = new DuplexChannelFactory<ICLMonitoringContract>(
           callback,
           pipe,
           new EndpointAddress(....));

  ICLMonitoringContract pipeProxy = pipeFactory.CreateChannel();
  ((IContextChannel)pipeProxy).OperationTimeout = new TimeSpan(24, 0, 0);
  ((IContextChannel)pipeProxy).Faulted += CLMonitoringServer_Faulted;

  pipeProxy.StopMonitoring(dumpPath);
}
When a client executes the StopMonitoring method, it actually runs at the server and makes it stop. And the client gets the data to run the analysis.
Now you have a grasp of the inner workings of the CLMonitor.exe utility.
Dump File and Figuring out the Problem
Ok, let's get back to the meat. Where were we? The user was sending us dump files from processes. The user had a hangup when trying to run the analysis, remember? Client and server processes were left hanging, no server closures. After exactly 10 minutes, this message appeared:
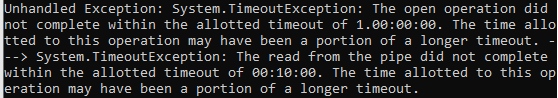
**Interesting fact. **Where did those 10 minutes even come from? The fact is that we set a much longer waiting time for a server to respond. It is 24 hours, as seen in the code example above. However, for some operations, the framework itself decides that it's too much and it will manage faster. Therefore, it takes only a part of the initial value.
We asked the user to get a dump from two processes (client and server) 5 minutes after the client was started to see what was going on there.
Pause for effect. I'd like to be honest to my colleague Paul and mention that he was the one who dealt with this problem. I was just fixing it. And now I'm writing the story about it:) The end of the pause.
'Client's' Dump
So when we opened the client's dump file, the following thread list opened to our eyes:

We are interested in the main thread. It hangs up on the method responsible for requesting a server stop:
public void FinishMonitor()
{
  ....
  ICLMonitoringContract pipeProxy = pipeFactory.CreateChannel();
  ((IContextChannel)pipeProxy).OperationTimeout = new TimeSpan(24, 0, 0);
  ((IContextChannel)pipeProxy).Faulted += CLMonitoringServer_Faulted;

  pipeProxy.StopMonitoring(dumpPath);            // <=
  ....
}
The client asked the server to shut down - no response followed. This behavior is strange - this is usually a split-second operation. In this case, it took 5 minutes to get the dump after the client started. Well, let's see how the server is doing.
'Server's' dump
We opened it and saw the following thread list:
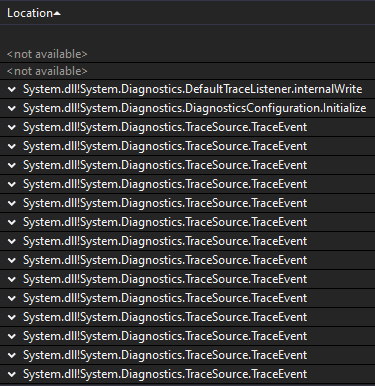
Wow, why so many TraceEvents? The screenshot didn't fit them all, but there were more than 50. Time to brainstorm. We use this method to log different information. For example, we caught a process - a compiler we don't support. This led to an error - reading a process parameter failed. We took a closer look at the thread data stacks - they all lead to the same method in our code. Our utility catches a process. This method checks if this process is a compiler or something different. If we caught such an uninteresting process, we log this information.
It turns out that the user runs a lot of processes that are 'trash' for us. Okay, let's go with it. The whole situation still looks suspicious. Why are there so many threads like this? In theory, logging should happen quickly. It looks like all these threads freeze up on a sync point or critical section and wait for something. Let's go to ReferenceSource and see the source code of the TraceEvent method.
Next we open the source files and really see the lock operator in the TraceEvent method:
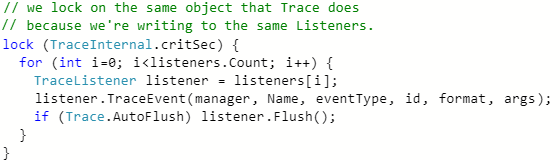
We suggested that such a large number of TraceEvent methods (that wait for TraceInternal.critSec release) owes to constant synchronization and logging. Hmm, let it be so. But this does not yet explain why the server is silent. After another look at the server dump file, we noticed one single thread that goes down on the DiagnosticsConfiguration.Initialize method:

We get to this method from the NegotiateStream.AuthenticateAsServer method that performs server-side authentication in the client-server connection:
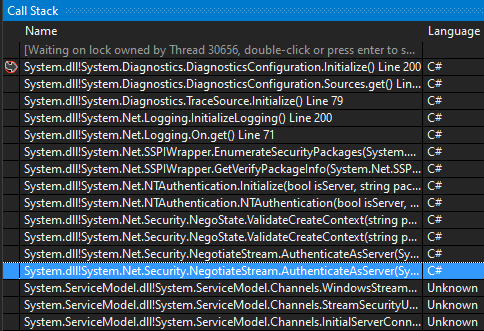
In our case, client-server interaction happens with WCF. Besides, the client still waits for a response from the server. This stack shows that the DiagnosticsConfiguration.Initialize method was called upon request from the client and now hangs up and waits. Hmm... and let's go to its source code:
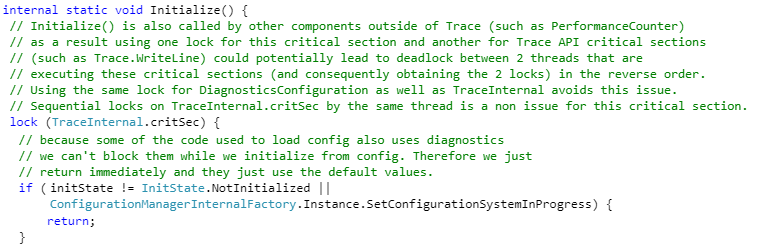
Here we notice that this method has a critical section for the same variable above. After looking at what this CritSec is, we see the following:

We now have enough information to draw conclusions.
Interesting fact. Surfing the Internet in search of information about this problem with TraceEvent yielded an interesting issue on GitHub. It actually covers another issue, but there's one entertaining comment from a Microsoft employee:
"Also one of the locks, TraceInternal.critSec, is only present if the TraceListener asks for it. Generally speaking such 'global' locks are not a good idea for a high performance logging system (indeed we don't recommend TraceSource for high performance logging at all, it is really there only for compatibility reasons)".
Microsoft team does not recommend using the code run-trace component for high-load systems. Whereas the team itself uses it in IPC framework that seemed reliable and resistant to heavy loads...
Dump Analysis Results
Here's what we have:
The client interacts with the server using the WCF framework.
The client can't get a response from the server. After 10 minutes of waiting, the client crashes by timeout.
Lots of threads freeze up on the server on the TraceEvent method and just one – on the *Initialize *method.
Both methods depend on the same variable in the critical section.
Threads where the TraceEvent method executes keep endlessly appearing. Due to lock they can't quickly do their thing and disappear. This is why they don't release the object from lock for a long time.
The Initialize method occurs when a client attempts to terminate the server and goes down indefinitely on lock.
This helps us realize that the server received a completion command from the client. The server shutdown method requires connection and the Initialize method execution. Here's why this method can't run. TraceEvent methods running on the server at this moment keep the object in the critical section. New TraceEvents keep appearing because the server keeps running and catching new 'trash' processes. So the client will never get response from the server, because the server infinitely logs delayed processes with TraceEvent. Problem found!
What really matters here is that the object in the critical section is a static variable. This means the error will repeat until instances of loggers exist in a single process. It doesn't matter that both we and WCF use different instances of loggers — seemingly independent objects create a mutual lock due to static variable in the critical section.
Time to reproduce and fix the problem.
How We Reproduced the Case
This problem is actually simple to reproduce. All we need is to make sure the server is constantly logging something. So we create a method with the talking name CrazyLogging that will do this:
private void CrazyLogging()
{
  for (var i = 0; i < 30; i++)
  {
    var j = i;
    new Thread(new ThreadStart(() =>
    {
      while (!Program.isStopMonitor)
        Logger.TraceEvent(TraceEventType.Error, 0, j.ToString());
    })).Start();
  }
}
The Trace method is responsible for the server operation, so we add our logging to it. For example, right here:
public void Trace()
{
  ListenersInitialization();
  CrazyLogging();
  ....
}
Done! Next we start the server (in my case using Visual Studio 2019), pause the process 5 seconds after, and see how threads are doing:

Great! Now we start the client (TestTraceSource.exe analyze). It has to connect to the server and stop it.
After the client's start, the analysis doesn't run. So again we stop threads in Visual Studio and see the same picture from the server dump file. Namely, there was a thread that hangs up on the DiagnosticsConfiguration.initialize method. We reproduced the problem.
How to fix it? It is worth to note that TraceSource is a class that provides a set of methods and properties that let apps trace code execution and link trace messages with their source. We use it because the server may not be attached to the console. This way console logging is pointless. In this case, we logged everything in Events of the operating system using the TraceSource.TraceEvent method.
We "solved" the problem as follows. By default, all information logs to the console using the Console.WriteLine method. This log information may be lost because of non-attached console. In most cases, it is not required to perform the utility's tasks. Anyway, the problem is gone. In addition, changes took just several minutes. However, we left the option to log as before using a special EnableLogger flag.
Code That Reproduces the Problem
Below is the source code fragment so you can conveniently reproduce the problem.
To run a simulation of the server, run .exe with the trace flag. Use the analyze flag to start the client.
Note: The number of threads in CrazyLogging should be chosen individually. If you can't get the problem, try playing around with this value. You can also run this project in Visual Studio in the debug mode.
Program entry point:
using System.Linq;

namespace TestTraceSource
{
  class Program
  {
    public static bool isStopMonitor = false;

    static void Main(string[] args)
    {
      if (!args.Any())
        return;

      if (args[0] == "trace")
      {
        Server server = new Server();
        server.Trace();
      }
      if (args[0] == "analyze")
      {
        Client client = new Client();
        client.FinishMonitor();
      }
    }
  }
}
Server:
using System;
using System.Diagnostics;
using System.ServiceModel;
using System.Threading;

namespace TestTraceSource
{
  class Server
  {
    private static TraceSource Logger;

    public void Trace()
    {
      ListenersInitialization();
      CrazyLogging();
      using (ServiceHost host = new ServiceHost(
                          typeof(TestTraceContract),
                          new Uri[]{new Uri(PipeCredentials.PipeRoot)}))
      {
        host.AddServiceEndpoint(typeof(IContract),
                                new NetNamedPipeBinding(),
                                PipeCredentials.PipeName);
        host.Open();

        while (!Program.isStopMonitor)
        {
          // We catch all processes, process them, and so on
        }

        host.Close();
      }

      Console.WriteLine("Complited.");
    }

    private void ListenersInitialization()
    {
      Logger = new TraceSource("PVS-Studio CLMonitoring");
      Logger.Switch.Level = SourceLevels.Verbose;
      Logger.Listeners.Add(new ConsoleTraceListener());

      String EventSourceName = "PVS-Studio CL Monitoring";

      EventLog log = new EventLog();
      log.Source = EventSourceName;
      Logger.Listeners.Add(new EventLogTraceListener(log));
    }

    private void CrazyLogging()
    {
      for (var i = 0; i < 30; i++)
      {
        var j = i;
        new Thread(new ThreadStart(() =>
        {
          var start = DateTime.Now;
          while (!Program.isStopMonitor)
            Logger.TraceEvent(TraceEventType.Error, 0, j.ToString());
        })).Start();
      }
    }
  }
}
Client:
using System;
using System.ServiceModel;

namespace TestTraceSource
{
  class Client
  {
    public void FinishMonitor()
    {
      TestTraceContractCallback callback = new TestTraceContractCallback();
      var pipeFactory = new DuplexChannelFactory<IContract>(
                                callback,
                                new NetNamedPipeBinding(),
                                new EndpointAddress(PipeCredentials.PipeRoot
                                                  + PipeCredentials.PipeName));
      IContract pipeProxy = pipeFactory.CreateChannel();
      pipeProxy.StopServer();

      Console.WriteLine("Complited.");
    }
  }
}
Proxy:
using System;
using System.ServiceModel;

namespace TestTraceSource
{
  class PipeCredentials
  {
    public const String PipeName = "PipeCLMonitoring";
    public const String PipeRoot = "net.pipe://localhost/";
    public const long MaxMessageSize = 500 * 1024 * 1024; //bytes
  }

  class TestTraceContractCallback : IContractCallback
  {
    public void JobComplete()
    {
      Console.WriteLine("Job Completed.");
    }
  }

  [ServiceContract(SessionMode = SessionMode.Required,
                   CallbackContract = typeof(IContractCallback))]
  interface IContract
  {
    [OperationContract]
    void StopServer();
  }

  interface IContractCallback
  {
    [OperationContract(IsOneWay = true)]
    void JobComplete();
  }

  [ServiceBehavior(InstanceContextMode = InstanceContextMode.Single)]
  class TestTraceContract : IContract
  {
    public void StopServer()
    {
      Program.isStopMonitor = true;
    }
  }
}
Conclusion
Be careful with the standard TraceSource.TraceEvent method. If you may be often using this method in a program, you may face a similar problem as well. Especially if you have a high-load system. In this case, developers themselves would not recommend using anything related to the TraceSource class. If you've encountered something like this before, feel free to share with us in comments.
Thanks for reading! I humbly suggest checking out my Twitter.
