Я из компании Luxoft. В этой статье будет рассматриваться проект nginx-clickhouse, который будет читать логи nginx, отправлять их в clickhouse. Для просмотра аналитики по логам есть дашборд для Grafana.
Устанавливаем nginx, clickhouse, grafana стандартным способом.
Все пакеты установлены на одном и том же сервере.
Страница nginx-clickhouse на github
Устанавливаем rpm пакет nginx-clickhouse
yum -y install yum-plugin-copr
yum copr enable antonpatsev/nginx-clickhouse-rpm
yum -y install nginx-clickhouse
systemctl start nginx-clickhouse
В качестве эмулятора HTTP сервиса используем mockify.
Устанавливаем rpm пакет mockify
yum -y install yum-plugin-copr
yum copr enable antonpatsev/mockify-rpm
yum -y install mockify
systemctl start mockify
У nginx-clickhouse log_format имеет следующий вид.
log_format main '$remote_addr - $remote_user [$time_local] "$request" $status $bytes_sent "$http_referer" "$http_user_agent"';Общий конфиг nginx:
user  nginx;
worker_processes  auto;
worker_rlimit_nofile 40960;

error_log  /var/log/nginx/error.log warn;
pid        /var/run/nginx.pid;

events {
    use epoll;
    worker_connections 1024;
    multi_accept on;
}

http {
    include       /etc/nginx/mime.types;
    default_type  application/octet-stream;

    log_format main '$remote_addr - $remote_user [$time_local] "$request" $status $bytes_sent "$http_referer" "$http_user_agent"';

    access_log /var/log/nginx/access.log main;

    sendfile on;
    tcp_nodelay on;
    tcp_nopush on;
    keepalive_timeout  65;

    include /etc/nginx/conf.d/*.conf;
    open_file_cache max=200000 inactive=20s;
    open_file_cache_valid 30s;
    open_file_cache_min_uses 2;
    open_file_cache_errors on;
}
Конфиги виртуальных хостов:
vhost1.conf:
server {
        listen   80;
        server_name vhost1;
        location / {
                proxy_pass http://127.0.0.1:8001/200;
        }
}
vhost2.conf:
server {
        listen   80;
        server_name vhost2;
        location / {
                proxy_pass http://127.0.0.1:8001/200;
        }
}
vhost3.conf:
server {
        listen   80;
        server_name vhost3;
        location / {
                proxy_pass http://localhost:8001/304;
        }
}
vhost4.conf:
server {
        listen   80;
        server_name vhost4;
        location / {
                proxy_pass http://localhost:8001/401;
        }
}
vhost5.conf:
server {
        listen   80;
        server_name vhost5;
        location / {
                proxy_pass http://localhost:8001/500;
        }
}
Добавляем в файл hosts виртуальные хосты:
cat /etc/hosts
127.0.0.1 vhost1
127.0.0.1 vhost2
127.0.0.1 vhost3
127.0.0.1 vhost4
127.0.0.1 vhost5
Конфиг nginx-clickhouse по умолчанию лежит в
/etc/nginx-clickhouse/config/config.ymlПуть до лога можно изменить в конфиге в параметре: log_path:
В clickhouse вам нужно создать базу данных metrics:
create database metricsИ нужно создать таблицу nginx:
CREATE TABLE metrics.nginx (
    RemoteAddr String,
    RemoteUser String,
    TimeLocal DateTime,
    Date Date DEFAULT toDate(TimeLocal),
    Request String,
    RequestMethod String,
    Status Int32,
    BytesSent Int64,
    HttpReferer String,
    HttpUserAgent String,
    RequestTime Float32,
    UpstreamConnectTime Float32,
    UpstreamHeaderTime Float32,
    UpstreamResponseTime Float32,
    Https FixedString(2),
    ConnectionsWaiting Int64,
    ConnectionsActive Int64
) ENGINE = MergeTree(Date, (Status, Date), 8192)
В Grafana при создании datasource для Clickhouse сделайте название ему ClickHouse Main Server, т.к. в исходном дашборде для Grafana именно так он именнуется.
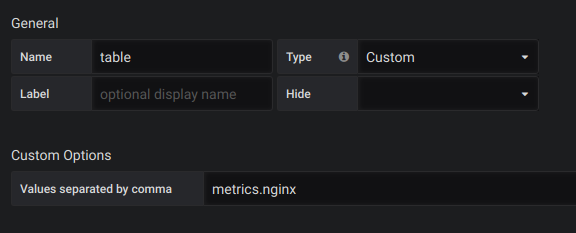
Так же вам нужно создать переменную table с содержимым metrics.nginx.
На официальном сайте Grafana вы не найдете дашборд. Он находится в этом закрытом issue:
Вот мой немного поправленный дашборд:
{
    "editable": true,
    "gnetId": null,
    "graphTooltip": 0,
    "hideControls": false,
    "id": 1,
    "links": [],
    "refresh": false,
    "rows": [
    {
    "collapse": false,
    "height": "250px",
    "panels": [
    {
    "aliasColors": {},
    "bars": false,
    "dashLength": 10,
    "dashes": false,
    "datasource": "ClickHouse Main Server",
    "fill": 1,
    "id": 1,
    "legend": {
    "avg": true,
    "current": true,
    "max": true,
    "min": true,
    "show": true,
    "total": false,
    "values": true
    },
    "lines": true,
    "linewidth": 1,
    "links": [],
    "nullPointMode": "null",
    "percentage": false,
    "pointradius": 5,
    "points": false,
    "renderer": "flot",
    "seriesOverrides": [],
    "spaceLength": 10,
    "span": 12,
    "stack": false,
    "steppedLine": false,
    "targets": [
    {
    "database": "metrics",
    "dateColDataType": "Date",
    "dateLoading": false,
    "dateTimeColDataType": "TimeLocal",
    "datetimeLoading": false,
    "formattedQuery": "<font color=\"darkcyan\">$columns</font>(Status, <font color=\"navajowhite\">count</font>(<font color=\"yellow\">*</font>) <font color=\"darkorange\">as</font> c) <font color=\"darkorange\">from</font> metrics<font color=\"yellow\">.</font>nginx_streaming",
    "hide": false,
    "interval": "15s",
    "intervalFactor": 1,
    "query": "$columns(Status, count(*) as c) from metrics.nginx",
    "rawQuery": "SELECT t, groupArray((Status, c)) as groupArr FROM ( SELECT (intDiv(toUInt32(TimeLocal), 15) * 15) * 1000 as t, Status, count(*) as c from metrics.nginx WHERE Date >= toDate(1539358595) AND TimeLocal >= toDateTime(1539358595) GROUP BY t, Status ORDER BY t) GROUP BY t ORDER BY t",
    "refId": "A",
    "resultFormat": "time_series",
    "table": "nginx_streaming",
    "tableLoading": false
    }
    ],
    "thresholds": [],
    "timeFrom": null,
    "timeShift": null,
    "title": "Streaming API Requests & Response",
    "tooltip": {
    "shared": true,
    "sort": 0,
    "value_type": "individual"
    },
    "type": "graph",
    "xaxis": {
    "buckets": null,
    "mode": "time",
    "name": null,
    "show": true,
    "values": []
    },
    "yaxes": [
    {
    "decimals": null,
    "format": "short",
    "label": "Requests",
    "logBase": 1,
    "max": null,
    "min": null,
    "show": true
    },
    {
    "format": "short",
    "label": "",
    "logBase": 1,
    "max": null,
    "min": null,
    "show": true
    }
    ]
    }
    ],
    "repeat": null,
    "repeatIteration": null,
    "repeatRowId": null,
    "showTitle": false,
    "title": "Dashboard Row",
    "titleSize": "h6"
    },
    {
    "collapse": false,
    "height": 399,
    "panels": [
    {
    "columns": [],
    "datasource": "ClickHouse Main Server",
    "fontSize": "100%",
    "id": 2,
    "links": [],
    "pageSize": null,
    "scroll": true,
    "showHeader": true,
    "sort": {
    "col": 0,
    "desc": true
    },
    "span": 6,
    "styles": [
    {
    "alias": "Time",
    "dateFormat": "YYYY-MM-DD HH:mm:ss",
    "pattern": "Time",
    "type": "date"
    },
    {
    "alias": "",
    "colorMode": null,
    "colors": [
    "rgba(245, 54, 54, 0.9)",
    "rgba(237, 129, 40, 0.89)",
    "rgba(50, 172, 45, 0.97)"
    ],
    "decimals": 2,
    "pattern": "/.*/",
    "thresholds": [],
    "type": "number",
    "unit": "short"
    }
    ],
    "targets": [
    {
    "database": "metrics",
    "dateColDataType": "Date",
    "dateLoading": false,
    "dateTimeColDataType": "TimeLocal",
    "datetimeLoading": false,
    "formattedQuery": "<font color=\"darkcyan\">$columns</font>(Status, <font color=\"navajowhite\">count</font>(<font color=\"yellow\">*</font>) <font color=\"darkorange\">as</font> c) <font color=\"darkorange\">from</font> metrics<font color=\"yellow\">.</font>nginx_streaming",
    "hide": false,
    "interval": "3600s",
    "intervalFactor": 1,
    "query": "$columns(Status, count(*) as c) from metrics.nginx",
    "rawQuery": "SELECT t, groupArray((Status, c)) as groupArr FROM ( SELECT (intDiv(toUInt32(TimeLocal), 3600) * 3600) * 1000 as t, Status, count(*) as c from metrics.nginx WHERE Date >= toDate(1539358595) AND TimeLocal >= toDateTime(1539358595) GROUP BY t, Status ORDER BY t) GROUP BY t ORDER BY t",
    "refId": "A",
    "resultFormat": "time_series",
    "table": "nginx_streaming",
    "tableLoading": false
    }
    ],
    "title": "Requests Stats Table",
    "transform": "timeseries_to_columns",
    "type": "table"
    },
    {
    "aliasColors": {},
    "bars": false,
    "dashLength": 10,
    "dashes": false,
    "datasource": "ClickHouse Main Server",
    "fill": 1,
    "id": 3,
    "legend": {
    "avg": false,
    "current": false,
    "max": false,
    "min": false,
    "show": true,
    "total": false,
    "values": false
    },
    "lines": true,
    "linewidth": 1,
    "links": [],
    "nullPointMode": "null",
    "percentage": false,
    "pointradius": 5,
    "points": false,
    "renderer": "flot",
    "seriesOverrides": [],
    "spaceLength": 10,
    "span": 6,
    "stack": false,
    "steppedLine": false,
    "targets": [
    {
    "database": "metrics",
    "dateColDataType": "Date",
    "dateLoading": false,
    "dateTimeColDataType": "TimeLocal",
    "datetimeLoading": false,
    "formattedQuery": "<font color=\"darkcyan\">$rate</font>(<font color=\"navajowhite\">avg</font>(RequestTime) <font color=\"darkorange\">as</font> RequestTime) <font color=\"darkorange\">FROM</font> metrics<font color=\"yellow\">.</font>nginx_streaming",
    "hide": false,
    "intervalFactor": 1,
    "query": "$rate(avg(RequestTime) as RequestTime) FROM metrics.nginx",
    "rawQuery": "SELECT t, RequestTime/runningDifference(t/1000) RequestTimeRate FROM ( SELECT (intDiv(toUInt32(TimeLocal), 120) * 120) * 1000 as t, avg(RequestTime) as RequestTime FROM metrics.nginx WHERE Date >= toDate(1539358595) AND TimeLocal >= toDateTime(1539358595) GROUP BY t ORDER BY t)",
    "refId": "A",
    "resultFormat": "time_series",
    "table": "nginx_streaming",
    "tableLoading": false
    },
    {
    "database": "metrics",
    "dateColDataType": "Date",
    "dateLoading": false,
    "dateTimeColDataType": "TimeLocal",
    "datetimeLoading": false,
    "formattedQuery": "<font color=\"darkcyan\">$rate</font>(<font color=\"navajowhite\">avg</font>(UpstreamResponseTime) <font color=\"darkorange\">as</font> UpstreamResponseTime) <font color=\"darkorange\">FROM</font> metrics<font color=\"yellow\">.</font>nginx_streaming",
    "hide": false,
    "intervalFactor": 1,
    "query": "$rate(avg(UpstreamResponseTime) as UpstreamResponseTime) FROM metrics.nginx",
    "rawQuery": "SELECT t, UpstreamResponseTime/runningDifference(t/1000) UpstreamResponseTimeRate FROM ( SELECT (intDiv(toUInt32(TimeLocal), 120) * 120) * 1000 as t, avg(UpstreamResponseTime) as UpstreamResponseTime FROM metrics.nginx WHERE Date >= toDate(1539358595) AND TimeLocal >= toDateTime(1539358595) GROUP BY t ORDER BY t)",
    "refId": "B",
    "resultFormat": "time_series",
    "table": "nginx_streaming",
    "tableLoading": false
    },
    {
    "database": "metrics",
    "dateColDataType": "Date",
    "dateLoading": false,
    "dateTimeColDataType": "TimeLocal",
    "datetimeLoading": false,
    "formattedQuery": "<font color=\"darkcyan\">$rate</font>(<font color=\"navajowhite\">avg</font>(UpstreamConnectTime) <font color=\"darkorange\">as</font> UpstreamConnectTime) <font color=\"darkorange\">FROM</font> metrics<font color=\"yellow\">.</font>nginx_streaming",
    "hide": false,
    "intervalFactor": 1,
    "query": "$rate(avg(UpstreamConnectTime) as UpstreamConnectTime) FROM metrics.nginx",
    "rawQuery": "SELECT t, UpstreamConnectTime/runningDifference(t/1000) UpstreamConnectTimeRate FROM ( SELECT (intDiv(toUInt32(TimeLocal), 120) * 120) * 1000 as t, avg(UpstreamConnectTime) as UpstreamConnectTime FROM metrics.nginx WHERE Date >= toDate(1539358595) AND TimeLocal >= toDateTime(1539358595) GROUP BY t ORDER BY t)",
    "refId": "C",
    "resultFormat": "time_series",
    "table": "nginx_streaming",
    "tableLoading": false
    }
    ],
    "thresholds": [],
    "timeFrom": null,
    "timeShift": null,
    "title": "Response Timing",
    "tooltip": {
    "shared": true,
    "sort": 0,
    "value_type": "individual"
    },
    "type": "graph",
    "xaxis": {
    "buckets": null,
    "mode": "time",
    "name": null,
    "show": true,
    "values": []
    },
    "yaxes": [
    {
    "format": "short",
    "label": null,
    "logBase": 1,
    "max": null,
    "min": null,
    "show": true
    },
    {
    "format": "short",
    "label": null,
    "logBase": 1,
    "max": null,
    "min": null,
    "show": true
    }
    ]
    }
    ],
    "repeat": null,
    "repeatIteration": null,
    "repeatRowId": null,
    "showTitle": false,
    "title": "Dashboard Row",
    "titleSize": "h6"
    },
    {
    "collapse": false,
    "height": 250,
    "panels": [
    {
    "cacheTimeout": null,
    "colorBackground": false,
    "colorValue": false,
    "colors": [
    "rgba(245, 54, 54, 0.9)",
    "rgba(237, 129, 40, 0.89)",
    "rgba(50, 172, 45, 0.97)"
    ],
    "datasource": "ClickHouse Main Server",
    "format": "none",
    "gauge": {
    "maxValue": 100,
    "minValue": 0,
    "show": false,
    "thresholdLabels": false,
    "thresholdMarkers": true
    },
    "id": 4,
    "interval": null,
    "links": [],
    "mappingType": 1,
    "mappingTypes": [
    {
    "name": "value to text",
    "value": 1
    },
    {
    "name": "range to text",
    "value": 2
    }
    ],
    "maxDataPoints": 100,
    "nullPointMode": "connected",
    "nullText": null,
    "postfix": "",
    "postfixFontSize": "50%",
    "prefix": "",
    "prefixFontSize": "50%",
    "rangeMaps": [
    {
    "from": "null",
    "text": "N/A",
    "to": "null"
    }
    ],
    "span": 2,
    "sparkline": {
    "fillColor": "rgba(31, 118, 189, 0.18)",
    "full": false,
    "lineColor": "rgb(31, 120, 193)",
    "show": false
    },
    "tableColumn": "",
    "targets": [
    {
    "database": "metrics",
    "dateColDataType": "Date",
    "dateLoading": false,
    "dateTimeColDataType": "TimeLocal",
    "datetimeLoading": false,
    "formattedQuery": "<font color=\"darkorange\">SELECT</font><br />        <font color=\"cornflowerblue\">1</font> <font color=\"darkorange\">as</font> t,<br />        <font color=\"navajowhite\">count</font>(<font color=\"yellow\">*</font>) <font color=\"darkorange\">as</font> c<br />    <font color=\"darkorange\">FROM</font> <font color=\"darkcyan\">$table</font><br />    <font color=\"darkorange\">WHERE</font> <font color=\"darkcyan\">$timeFilter</font> <font color=\"darkorange\">GROUP BY</font> t",
    "intervalFactor": 1,
    "query": "SELECT\n 1 as t,\n count(*) as c\n FROM $table\n WHERE $timeFilter GROUP BY t",
    "rawQuery": "SELECT 1 as t, count(*) as c FROM metrics.nginx WHERE Date >= toDate(1539358595) AND TimeLocal >= toDateTime(1539358595) GROUP BY t",
    "refId": "A",
    "resultFormat": "time_series",
    "table": "nginx_streaming",
    "tableLoading": false
    }
    ],
    "thresholds": "",
    "title": "Total Requests",
    "type": "singlestat",
    "valueFontSize": "80%",
    "valueMaps": [
    {
    "op": "=",
    "text": "N/A",
    "value": "null"
    }
    ],
    "valueName": "avg"
    },
    {
    "cacheTimeout": null,
    "colorBackground": false,
    "colorValue": false,
    "colors": [
    "rgba(245, 54, 54, 0.9)",
    "rgba(237, 129, 40, 0.89)",
    "rgba(50, 172, 45, 0.97)"
    ],
    "datasource": "ClickHouse Main Server",
    "format": "ops",
    "gauge": {
    "maxValue": 100,
    "minValue": 0,
    "show": false,
    "thresholdLabels": false,
    "thresholdMarkers": true
    },
    "id": 5,
    "interval": null,
    "links": [],
    "mappingType": 1,
    "mappingTypes": [
    {
    "name": "value to text",
    "value": 1
    },
    {
    "name": "range to text",
    "value": 2
    }
    ],
    "maxDataPoints": 100,
    "nullPointMode": "connected",
    "nullText": null,
    "postfix": "",
    "postfixFontSize": "50%",
    "prefix": "",
    "prefixFontSize": "50%",
    "rangeMaps": [
    {
    "from": "null",
    "text": "N/A",
    "to": "null"
    }
    ],
    "span": 2,
    "sparkline": {
    "fillColor": "rgba(31, 118, 189, 0.18)",
    "full": false,
    "lineColor": "rgb(31, 120, 193)",
    "show": false
    },
    "tableColumn": "",
    "targets": [
    {
    "database": "metrics",
    "dateColDataType": "Date",
    "dateLoading": false,
    "dateTimeColDataType": "TimeLocal",
    "datetimeLoading": false,
    "formattedQuery": "<font color=\"darkorange\">SELECT</font><br />        <font color=\"cornflowerblue\">1</font> <font color=\"darkorange\">as</font> t,<br />        <font color=\"navajowhite\">count</font>(<font color=\"yellow\">*</font>) <font color=\"yellow\">/</font> <font color=\"cornflowerblue\">3600</font><font color=\"yellow\">*</font><font color=\"cornflowerblue\">24</font> <font color=\"darkorange\">as</font> c<br />    <font color=\"darkorange\">FROM</font> <font color=\"darkcyan\">$table</font><br />    <font color=\"darkorange\">WHERE</font> <font color=\"darkcyan\">$timeFilter</font> <font color=\"darkorange\">GROUP BY</font> t",
    "intervalFactor": 1,
    "query": "SELECT\n 1 as t,\n count(*) / 3600*24 as c\n FROM $table\n WHERE $timeFilter GROUP BY t",
    "rawQuery": "SELECT 1 as t, count(*) / 3600*24 as c FROM metrics.nginx WHERE Date >= toDate(1539358595) AND TimeLocal >= toDateTime(1539358595) GROUP BY t",
    "refId": "A",
    "resultFormat": "time_series",
    "table": "nginx_streaming",
    "tableLoading": false
    }
    ],
    "thresholds": "",
    "title": "RPS",
    "type": "singlestat",
    "valueFontSize": "80%",
    "valueMaps": [
    {
    "op": "=",
    "text": "N/A",
    "value": "null"
    }
    ],
    "valueName": "avg"
    },
    {
    "cacheTimeout": null,
    "colorBackground": true,
    "colorValue": false,
    "colors": [
    "rgba(50, 172, 45, 0.97)",
    "rgba(237, 129, 40, 0.89)",
    "rgba(245, 54, 54, 0.9)"
    ],
    "datasource": "ClickHouse Main Server",
    "format": "none",
    "gauge": {
    "maxValue": 100,
    "minValue": 0,
    "show": false,
    "thresholdLabels": false,
    "thresholdMarkers": true
    },
    "id": 6,
    "interval": null,
    "links": [],
    "mappingType": 1,
    "mappingTypes": [
    {
    "name": "value to text",
    "value": 1
    },
    {
    "name": "range to text",
    "value": 2
    }
    ],
    "maxDataPoints": 100,
    "nullPointMode": "connected",
    "nullText": null,
    "postfix": "",
    "postfixFontSize": "50%",
    "prefix": "",
    "prefixFontSize": "50%",
    "rangeMaps": [
    {
    "from": "null",
    "text": "N/A",
    "to": "null"
    }
    ],
    "span": 2,
    "sparkline": {
    "fillColor": "rgba(31, 118, 189, 0.18)",
    "full": false,
    "lineColor": "rgb(31, 120, 193)",
    "show": false
    },
    "tableColumn": "",
    "targets": [
    {
    "database": "metrics",
    "dateColDataType": "Date",
    "dateLoading": false,
    "dateTimeColDataType": "TimeLocal",
    "datetimeLoading": false,
    "formattedQuery": "<font color=\"darkorange\">SELECT</font><br />        <font color=\"cornflowerblue\">1</font> <font color=\"darkorange\">as</font> t,<br />        <font color=\"navajowhite\">count</font>(<font color=\"yellow\">*</font>) <font color=\"darkorange\">as</font> c<br />    <font color=\"darkorange\">FROM</font> <font color=\"darkcyan\">$table</font><br />    <font color=\"darkorange\">WHERE</font> <font color=\"darkcyan\">$timeFilter</font> <font color=\"yellow\">AND</font> Status <font color=\"darkorange\">NOT</font> <font color=\"darkorange\">IN</font> (<font color=\"cornflowerblue\">200</font>, <font color=\"cornflowerblue\">201</font>, <font color=\"cornflowerblue\">401</font>) <font color=\"darkorange\">GROUP BY</font> t",
    "intervalFactor": 1,
    "query": "SELECT\n 1 as t,\n count(*) as c\n FROM $table\n WHERE $timeFilter AND Status NOT IN (200, 201, 401) GROUP BY t",
    "rawQuery": "SELECT 1 as t, count(*) as c FROM metrics.nginx WHERE Date >= toDate(1539358595) AND TimeLocal >= toDateTime(1539358595) AND Status NOT IN (200, 201, 401) GROUP BY t",
    "refId": "A",
    "resultFormat": "time_series",
    "table": "nginx_streaming",
    "tableLoading": false
    }
    ],
    "thresholds": "10,20,50",
    "title": "Failed Requests",
    "type": "singlestat",
    "valueFontSize": "80%",
    "valueMaps": [
    {
    "op": "=",
    "text": "N/A",
    "value": "null"
    }
    ],
    "valueName": "avg"
    },
    {
    "cacheTimeout": null,
    "colorBackground": true,
    "colorValue": false,
    "colors": [
    "rgba(50, 172, 45, 0.97)",
    "rgba(237, 129, 40, 0.89)",
    "rgba(245, 54, 54, 0.9)"
    ],
    "datasource": "ClickHouse Main Server",
    "decimals": null,
    "format": "none",
    "gauge": {
    "maxValue": 100,
    "minValue": 0,
    "show": false,
    "thresholdLabels": false,
    "thresholdMarkers": true
    },
    "id": 9,
    "interval": null,
    "links": [],
    "mappingType": 1,
    "mappingTypes": [
    {
    "name": "value to text",
    "value": 1
    },
    {
    "name": "range to text",
    "value": 2
    }
    ],
    "maxDataPoints": 100,
    "nullPointMode": "connected",
    "nullText": null,
    "postfix": "%",
    "postfixFontSize": "80%",
    "prefix": "",
    "prefixFontSize": "50%",
    "rangeMaps": [
    {
    "from": "null",
    "text": "N/A",
    "to": "null"
    }
    ],
    "span": 2,
    "sparkline": {
    "fillColor": "rgba(31, 118, 189, 0.18)",
    "full": false,
    "lineColor": "rgb(31, 120, 193)",
    "show": false
    },
    "tableColumn": "",
    "targets": [
    {
    "database": "metrics",
    "dateColDataType": "Date",
    "dateLoading": false,
    "dateTimeColDataType": "TimeLocal",
    "datetimeLoading": false,
    "formattedQuery": "<font color=\"darkorange\">SELECT</font><br />        <font color=\"cornflowerblue\">1</font> <font color=\"darkorange\">as</font> t, (<font color=\"navajowhite\">sum</font>(Status <font color=\"yellow\">=</font> <font color=\"cornflowerblue\">500</font> <font color=\"yellow\">or</font> Status <font color=\"yellow\">=</font> <font color=\"cornflowerblue\">499</font>)<font color=\"yellow\">/</font><font color=\"navajowhite\">sum</font>(Status <font color=\"yellow\">=</font> <font color=\"cornflowerblue\">200</font> <font color=\"yellow\">or</font> Status <font color=\"yellow\">=</font> <font color=\"cornflowerblue\">201</font> <font color=\"yellow\">or</font> Status <font color=\"yellow\">=</font> <font color=\"cornflowerblue\">401</font>))<font color=\"yellow\">*</font><font color=\"cornflowerblue\">100</font> <font color=\"darkorange\">FROM</font> <font color=\"darkcyan\">$table</font><br />    <font color=\"darkorange\">WHERE</font> <font color=\"darkcyan\">$timeFilter</font> <font color=\"darkorange\">GROUP BY</font> t",
    "intervalFactor": 1,
    "query": "SELECT\n 1 as t, (sum(Status = 500 or Status = 499)/sum(Status = 200 or Status = 201 or Status = 401))*100 FROM $table\n WHERE $timeFilter GROUP BY t",
    "rawQuery": "SELECT 1 as t, (sum(Status = 500 or Status = 499)/sum(Status = 200 or Status = 201 or Status = 401))*100 FROM metrics.nginx WHERE Date >= toDate(1539358595) AND TimeLocal >= toDateTime(1539358595) GROUP BY t",
    "refId": "A",
    "resultFormat": "time_series",
    "table": "nginx_streaming",
    "tableLoading": false
    }
    ],
    "thresholds": "1,5",
    "title": "Failing Prcent",
    "type": "singlestat",
    "valueFontSize": "80%",
    "valueMaps": [
    {
    "op": "=",
    "text": "N/A",
    "value": "null"
    }
    ],
    "valueName": "current"
    },
    {
    "cacheTimeout": null,
    "colorBackground": true,
    "colorValue": false,
    "colors": [
    "rgba(245, 54, 54, 0.9)",
    "rgba(237, 129, 40, 0.89)",
    "rgba(50, 172, 45, 0.97)"
    ],
    "datasource": "ClickHouse Main Server",
    "format": "s",
    "gauge": {
    "maxValue": 100,
    "minValue": 0,
    "show": false,
    "thresholdLabels": false,
    "thresholdMarkers": true
    },
    "id": 7,
    "interval": null,
    "links": [],
    "mappingType": 1,
    "mappingTypes": [
    {
    "name": "value to text",
    "value": 1
    },
    {
    "name": "range to text",
    "value": 2
    }
    ],
    "maxDataPoints": 100,
    "nullPointMode": "connected",
    "nullText": null,
    "postfix": "",
    "postfixFontSize": "50%",
    "prefix": "",
    "prefixFontSize": "50%",
    "rangeMaps": [
    {
    "from": "null",
    "text": "N/A",
    "to": "null"
    }
    ],
    "span": 2,
    "sparkline": {
    "fillColor": "rgba(31, 118, 189, 0.18)",
    "full": false,
    "lineColor": "rgb(31, 120, 193)",
    "show": false
    },
    "tableColumn": "",
    "targets": [
    {
    "database": "metrics",
    "dateColDataType": "Date",
    "dateLoading": false,
    "dateTimeColDataType": "TimeLocal",
    "datetimeLoading": false,
    "formattedQuery": "<font color=\"darkorange\">SELECT</font><br />        <font color=\"cornflowerblue\">1</font>, <font color=\"navajowhite\">avg</font>(RequestTime) <font color=\"darkorange\">FROM</font> <font color=\"darkcyan\">$table</font><br />    <font color=\"darkorange\">WHERE</font> <font color=\"darkcyan\">$timeFilter</font> <font color=\"darkorange\">GROUP BY</font> <font color=\"cornflowerblue\">1</font>",
    "intervalFactor": 1,
    "query": "SELECT\n 1, avg(RequestTime) FROM $table\n WHERE $timeFilter GROUP BY 1",
    "rawQuery": "SELECT 1, avg(RequestTime) FROM metrics.nginx WHERE Date >= toDate(1539358595) AND TimeLocal >= toDateTime(1539358595) GROUP BY 1",
    "refId": "A",
    "resultFormat": "time_series",
    "table": "nginx_streaming",
    "tableLoading": false
    }
    ],
    "thresholds": "0.02,0.05,0.1",
    "title": "Avg Response Time",
    "type": "singlestat",
    "valueFontSize": "80%",
    "valueMaps": [
    {
    "op": "=",
    "text": "N/A",
    "value": "null"
    }
    ],
    "valueName": "avg"
    },
    {
    "cacheTimeout": null,
    "colorBackground": true,
    "colorValue": false,
    "colors": [
    "rgba(50, 172, 45, 0.97)",
    "rgba(237, 129, 40, 0.89)",
    "rgba(245, 54, 54, 0.9)"
    ],
    "datasource": "ClickHouse Main Server",
    "decimals": null,
    "format": "s",
    "gauge": {
    "maxValue": 100,
    "minValue": 0,
    "show": false,
    "thresholdLabels": false,
    "thresholdMarkers": true
    },
    "id": 8,
    "interval": null,
    "links": [],
    "mappingType": 1,
    "mappingTypes": [
    {
    "name": "value to text",
    "value": 1
    },
    {
    "name": "range to text",
    "value": 2
    }
    ],
    "maxDataPoints": 100,
    "nullPointMode": "connected",
    "nullText": null,
    "postfix": "",
    "postfixFontSize": "70%",
    "prefix": "",
    "prefixFontSize": "50%",
    "rangeMaps": [
    {
    "from": "null",
    "text": "N/A",
    "to": "null"
    }
    ],
    "span": 2,
    "sparkline": {
    "fillColor": "rgba(31, 118, 189, 0.18)",
    "full": false,
    "lineColor": "rgb(31, 120, 193)",
    "show": false
    },
    "tableColumn": "",
    "targets": [
    {
    "database": "metrics",
    "dateColDataType": "Date",
    "dateLoading": false,
    "dateTimeColDataType": "TimeLocal",
    "datetimeLoading": false,
    "formattedQuery": "<font color=\"darkorange\">SELECT</font><br />        <font color=\"cornflowerblue\">1</font> <font color=\"darkorange\">as</font> t, <font color=\"navajowhite\">max</font>(RequestTime) <font color=\"darkorange\">as</font> c<br />    <font color=\"darkorange\">FROM</font> <font color=\"darkcyan\">$table</font><br />    <font color=\"darkorange\">WHERE</font> <font color=\"darkcyan\">$timeFilter</font> <font color=\"darkorange\">GROUP BY</font> t",
    "intervalFactor": 1,
    "query": "SELECT\n 1 as t, max(RequestTime) as c\n FROM $table\n WHERE $timeFilter GROUP BY t",
    "rawQuery": "SELECT 1 as t, max(RequestTime) as c FROM metrics.nginx WHERE Date >= toDate(1539358595) AND TimeLocal >= toDateTime(1539358595) GROUP BY t",
    "refId": "A",
    "resultFormat": "time_series",
    "table": "nginx_streaming",
    "tableLoading": false
    }
    ],
    "thresholds": "0.2,0.5,1",
    "title": "Max Response Time",
    "type": "singlestat",
    "valueFontSize": "80%",
    "valueMaps": [
    {
    "op": "=",
    "text": "N/A",
    "value": "null"
    }
    ],
    "valueName": "current"
    }
    ],
    "repeat": null,
    "repeatIteration": null,
    "repeatRowId": null,
    "showTitle": false,
    "title": "Dashboard Row",
    "titleSize": "h6"
    },
    {
    "collapse": false,
    "height": "450",
    "panels": [
    {
    "columns": [],
    "datasource": "ClickHouse Main Server",
    "fontSize": "100%",
    "id": 11,
    "links": [],
    "pageSize": null,
    "scroll": true,
    "showHeader": true,
    "sort": {
    "col": 0,
    "desc": true
    },
    "span": 8,
    "styles": [
    {
    "alias": "Time",
    "dateFormat": "HH:mm:ss",
    "pattern": "Time",
    "type": "date"
    },
    {
    "alias": "",
    "colorMode": null,
    "colors": [
    "rgba(245, 54, 54, 0.9)",
    "rgba(237, 129, 40, 0.89)",
    "rgba(50, 172, 45, 0.97)"
    ],
    "dateFormat": "YYYY-MM-DD HH:mm:ss",
    "decimals": 0,
    "pattern": "Status",
    "thresholds": [],
    "type": "number",
    "unit": "none"
    },
    {
    "alias": "Response Time",
    "colorMode": null,
    "colors": [
    "rgba(50, 172, 45, 0.97)",
    "rgba(237, 129, 40, 0.89)",
    "rgba(245, 54, 54, 0.9)"
    ],
    "dateFormat": "YYYY-MM-DD HH:mm:ss",
    "decimals": 2,
    "pattern": "RequestTime",
    "thresholds": [
    "50",
    "70",
    "100"
    ],
    "type": "number",
    "unit": "dtdurations"
    },
    {
    "alias": "",
    "colorMode": null,
    "colors": [
    "rgba(245, 54, 54, 0.9)",
    "rgba(237, 129, 40, 0.89)",
    "rgba(50, 172, 45, 0.97)"
    ],
    "decimals": 2,
    "pattern": "/.*/",
    "thresholds": [],
    "type": "number",
    "unit": "short"
    }
    ],
    "targets": [
    {
    "database": "metrics",
    "dateColDataType": "Date",
    "dateLoading": false,
    "dateTimeColDataType": "TimeLocal",
    "datetimeLoading": false,
    "formattedQuery": "SELECT TimeLocal as t, Status, RequestMethod, splitByChar(' ', Request)[2] as Request, RequestTime FROM $table WHERE $timeFilter AND Status NOT IN (200, 201) AND RequestMethod != 'OPTIONS' ORDER BY t",
    "intervalFactor": 1,
    "query": "SELECT TimeLocal as t, Status, RequestMethod, splitByChar(' ', Request)[2] as Request, RequestTime FROM $table WHERE $timeFilter AND Status NOT IN (200, 201) AND RequestMethod != 'OPTIONS' ORDER BY t",
    "rawQuery": "SELECT TimeLocal as t, Status, RequestMethod, splitByChar(' ', Request)[2] as Request, RequestTime FROM metrics.nginx WHERE Date >= toDate(1539358595) AND TimeLocal >= toDateTime(1539358595) AND Status NOT IN (200, 201) AND RequestMethod != 'OPTIONS' ORDER BY t",
    "refId": "A",
    "resultFormat": "time_series",
    "table": "nginx_streaming",
    "tableLoading": false
    }
    ],
    "title": "Error Requests",
    "transform": "timeseries_to_columns",
    "type": "table"
    }
    ],
    "repeat": null,
    "repeatIteration": null,
    "repeatRowId": null,
    "showTitle": false,
    "title": "Dashboard Row",
    "titleSize": "h6"
    }
    ],
    "schemaVersion": 14,
    "style": "dark",
    "tags": [],
    "templating": {
    "list": []
    },
    "time": {
    "from": "now-24h",
    "to": "now"
    },
    "timepicker": {
    "refresh_intervals": [
    "5s",
    "10s",
    "30s",
    "1m",
    "5m",
    "15m",
    "30m",
    "1h",
    "2h",
    "1d"
    ],
    "time_options": [
    "5m",
    "15m",
    "1h",
    "6h",
    "12h",
    "24h",
    "2d",
    "7d",
    "30d"
    ]
    },
    "timezone": "",
    "title": "Streaming API",
    "version": 17
    }
Тестирование проводим с помощью Apache benchmark.
Устанавливаем его:
yum install -y httpd-toolsЗапускаем тестирование с помощью Apache benchmark в разных консолях:
while true; do ab -c 1 -n 1 -t 1 http://vhost1/; sleep 2; done
while true; do ab -c 1 -n 1 -t 1 http://vhost2/; sleep 2; done
while true; do ab -c 1 -n 1 -t 1 http://vhost3/; sleep 2; done
while true; do ab -c 1 -n 1 -t 1 http://vhost4/; sleep 2; done
while true; do ab -c 1 -n 1 -t 1 http://vhost5/; sleep 2; done
Скриншоты:
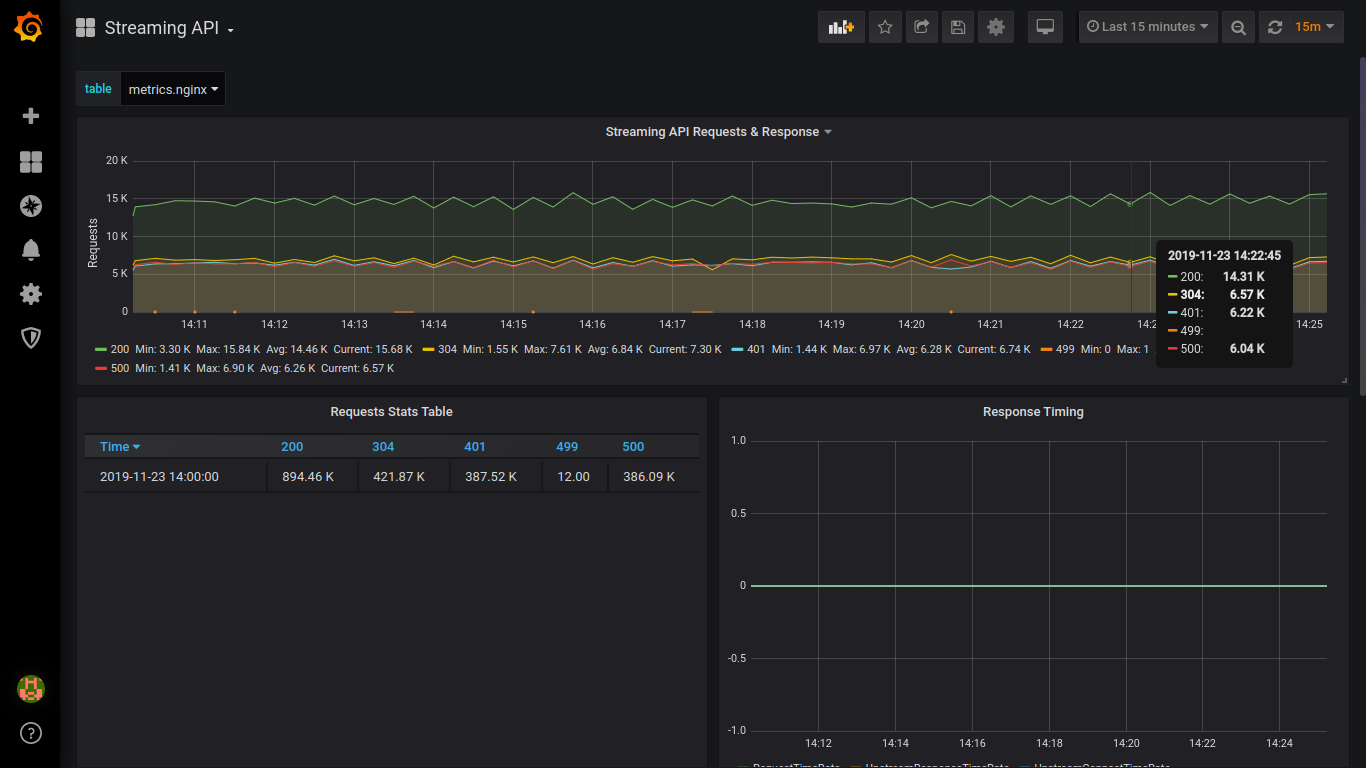
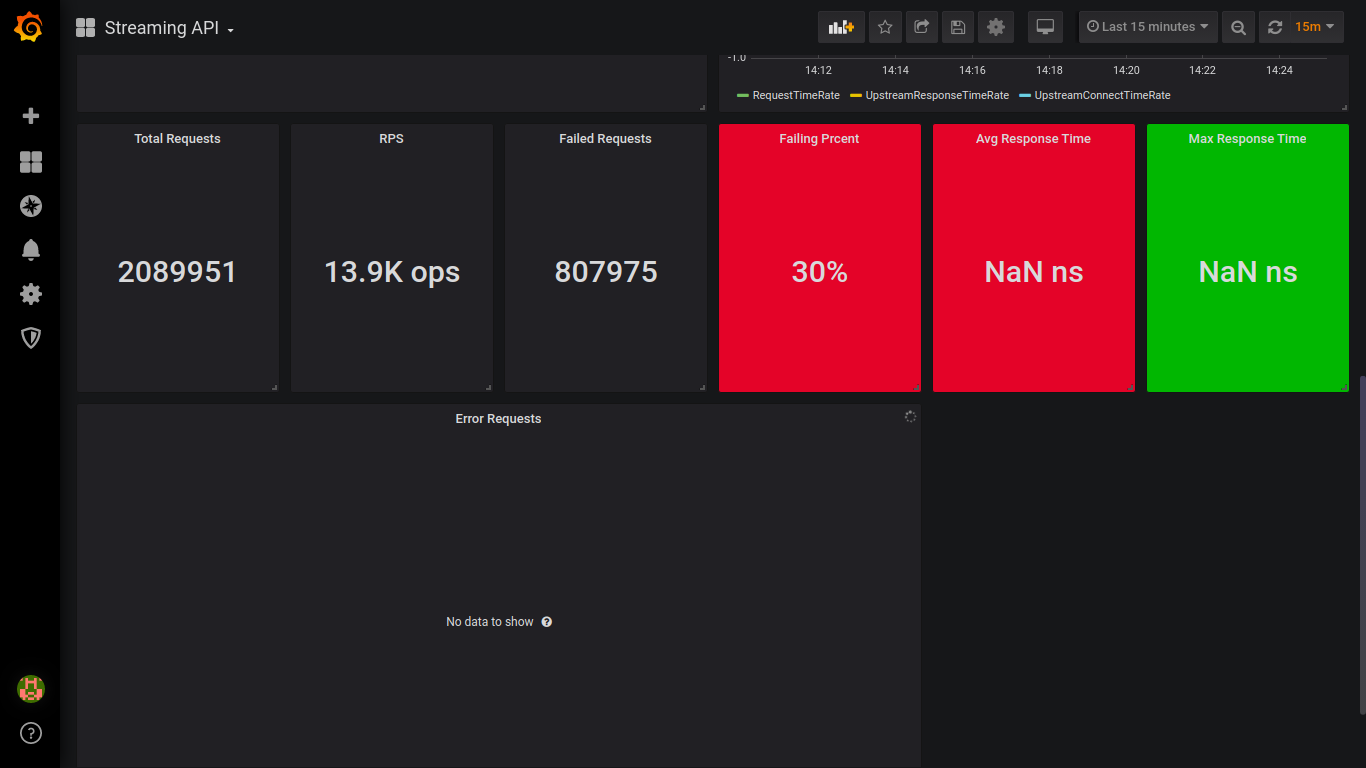
Скриншот с github разработчика:

Вывод:
Надеюсь на дальнейшее развитие проекта. Пока проект малоактивный.
Если вы будете собирать проект руками, то обратите внимание на этот issue.
Telegram каналы:
Clickhouse
Nginx
Церковь метрик
Вопрос к читателям: Если вы храните метрики в clickhouse, то какими self-hosted утилитами/проектами вы получаете метрики по статус кодам и по виртуальным хостам с Nginx?
UPDATE: Автор проекта принял мои Pull Request:
https://github.com/mintance/nginx-clickhouse/pull/9
https://github.com/mintance/nginx-clickhouse/pull/10
https://github.com/mintance/nginx-clickhouse/pull/11
Также автор стал отвечать в Issue:
https://github.com/mintance/nginx-clickhouse/issues/7
https://github.com/mintance/nginx-clickhouse/issues/8
