Tested on the following configuration:
Server: ubuntu 20.04
Clients: ubuntu 16.04, 18.04, 20.04
It doesn’t require a lot of software to create it.
Tested on the following configuration:
Server: ubuntu 20.04
Clients: ubuntu 16.04, 18.04, 20.04
It doesn’t require a lot of software to create it.

Let's once again improve Ansible. Well, this won't work without getting into sources.

Let's say you use GitHub, write code, and do other fun stuff. You also use a static analyzer to enhance your work quality and optimize the timing. Once you come up with an idea - why not view the errors that the analyzer gave right in GitHub? Yeah, and also it would be great if it looked nice. So, what should you do? The answer is very simple. SARIF is right for you. This article will cover what SARIF is and how to set it up. Enjoy the reading!
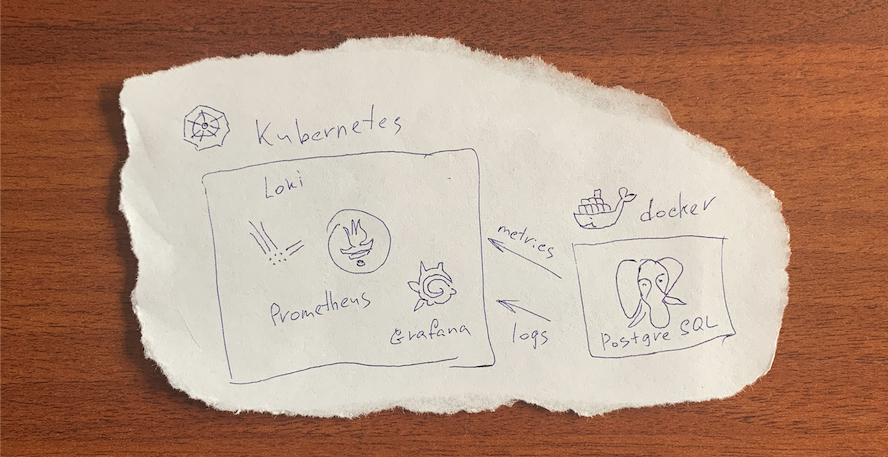
All Prometheus metrics are based on time series - streams of timestamped values belonging to the same metric. Each time series is uniquely identified by its metric name and optional key-value pairs called labels. The metric name specifies some characteristics of the measured system, such as http_requests_total - the total number of received HTTP requests. In practice, you often will be interested in some subset of the values of a metric, for example, in the number of requests received by a particular endpoint; and here is where the labels come in handy. We can partition a metric by adding endpoint label and see the statics for a particular endpoint: http_requests_total{endpoint="api/status"}. Every metric has two automatically created labels: job_name and instance. We see their roles in the next section.
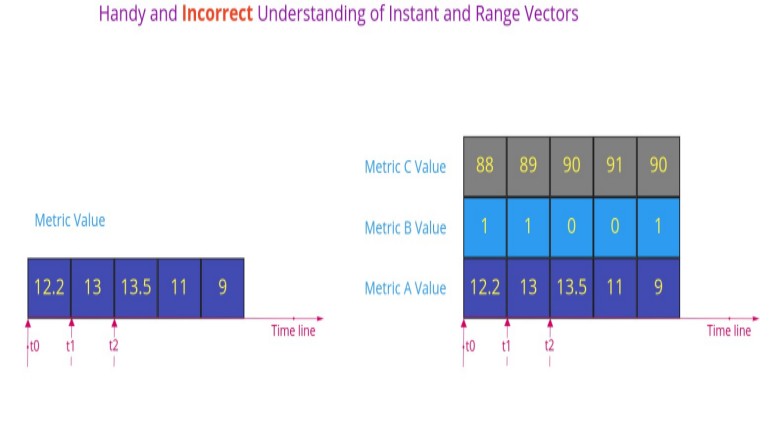
Prometheus provides a functional query language called PromQL. The result of the query might be evaluated to one of four types:
Scalar (aka float)
String (currently unused)
Instant Vector - a set of time series that have exactly one value per timestamp.
Range Vector - a set of time series that have a range of values between two timestamps.
At first glance, Instant Vector might look like an array, and Range Vector as a matrix.
If that would be the case, then a Range Vector for a single time series "downgrades" to an Instant Vector. However, that's not the case:

What is distributed tracing? Distributed tracing is a method used to profile and monitor applications, especially those built using a microservices architecture. Distributed tracing helps pinpoint where failures occur and what causes poor performance.
Let’s have a look at a simple prototype. A user fetches information about a shipment from `logistic` service. logistic service does some computation and fetches the data from a database. logistic service doesn’t know the actual status of the shipment, so it has to fetch the updated status from another service `tracking`. `tracking` service also needs to fetch the data from a database and to do some computation.
In the screenshot below, we see a whole life cycle of the request issued to `logistics` service:

"Come, let us make bricks, and burn them thoroughly."
– legendary builders
You may have noticed by 2020 that data is eating the world. And whenever any reasonable amount of data needs processing, a complicated multi-stage data processing pipeline will be involved.
At Bumble — the parent company operating Badoo and Bumble apps — we apply hundreds of data transforming steps while processing our data sources: a high volume of user-generated events, production databases and external systems. This all adds up to quite a complex system! And just as with any other engineering system, unless carefully maintained, pipelines tend to turn into a house of cards — failing daily, requiring manual data fixes and constant monitoring.
For this reason, I want to share certain good engineering practises with you, ones that make it possible to build scalable data processing pipelines from composable steps. While some engineers understand such rules intuitively, I had to learn them by doing, making mistakes, fixing, sweating and fixing things again…
So behold! I bring you my favourite Rules for Data Processing Pipeline Builders.
There probably is no way one who stores some crucial data (and well, in particular, using SQL databases) can possibly dodge from thoughts of building some kind of safe cluster, distant guardian to protect consistency and availability at all times. Even if the main server with your precious database gets knocked out deadly - the show must go on, right? This basically means the database must still be available and data be up-to-date with the one on the failed server.
As you might have noticed, there are dozens of ways to go and Patroni is just one of them. There is plenty of articles providing a more or less detailed comparison of the options available, so I assume I'm free to skip the part of luring you into Patroni's side. Let's start off from the point where among others you are already leaning towards Patroni and are willing to try that out in a more or less real-case setup.
I am not a DevOps engineer originally so when the need for the high-availability cluster arose and I went on I would catch every single bump on the road. Hope this tutorial will help you out to get the job done with ease! If you don't want any more explanations, jump right in. Otherwise, you might want to read some more notes on the setup I went on with.

Major players in the Chinese app market are joining forces to take on the almighty Google Play store. Xiaomi, Oppo and Vivo are reported to launch the Global Developer Service Alliance (GDSA), a platform allowing Android developers to publish their apps in the partnering stores from one upload.
The GDSA is expected to launch in nine countries—including India, Indonesia, Malaysia, Russia, Spain, Thailand, the Philippines, and Vietnam—although paid app support may vary across the regions. Canalys’ Nicole Peng explains the wide reach of this alliance:
By forming this alliance each company will be looking to leverage the others’ advantages in different regions, with Xiaomi’s strong user base in India, Vivo and Oppo in Southeast Asia, and Huawei in Europe.
Before we start, I'd like to get on the same page with you. So, could you please answer? How much time will it take to:
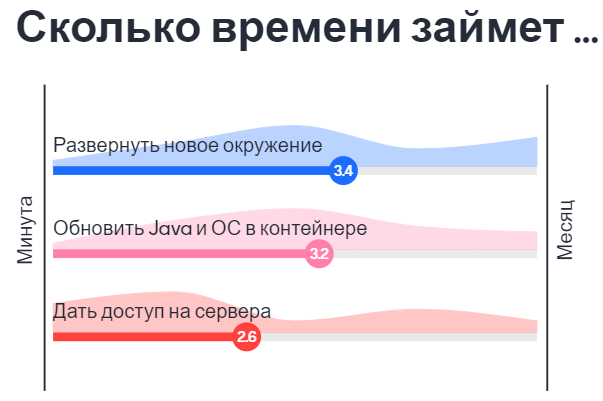
It will take longer than you expect. I will explain why.
This post is handling the following situation - how to setup up simple Mysql services with group replication being dockerized. In our case, we’ll take the latest Mysql (version 8.x.x)
FYI: all mentioned code (worked and tested manually) located here.
I will skip not interested steps like ‘what is Mysql, Docker and why we choose them, etc’. We want to set up possibly trouble proof DB. That’s our plan.


Academic data warehouse design recommends keeping everything in a normalized form, with links between. Then the roll forward of changes in relational math will provide a reliable repository with transaction support. Atomicity, Consistency, Isolation, Durability — that's all. In other words, the storage is explicitly built to safely update the data. But it is not optimal for searching, especially with a broad gesture on the tables and fields. We need indices, a lot of indices! Volumes expand, recording slows down. SQL LIKE can not be indexed, and JOIN GROUP BY sends us to meditate in the query planner.


We have all been there — having a nice idea for a hackathon, hobby or a side project and having a burning desire to start coding as soon as possible. And how many possibilities (Heroku, Glitch and others) are there now to bootstrap your app and deploy it immediately.