In this article, I decided to describe how the functionality of selecting and displaying photos on a specific place on the map was implemented in our photo service gfranq.com. The photo service does not work now.

Since we had a lot of photos in our service and sending requests to database every time the viewport changes was too resource-intensive, it was logical to divide the map into several areas that contain information about the retrieved data. For obvious reasons, these areas have rectangular shape (although hexagonal grid was considered too). As the areas become more spherical at large scales, elements of spherical geometry and tools for it were also considered.
In this article, the following issues were raised:
- Storing and retrieving photos from the database and caching them on the server (SQL, C#, ASP.NET).
- Downloading necessary photos on the client side and saving them to the client cache (JavaScript).
- Recalculation of photos that must be hidden or shown when the viewport changes.
- Elements of spherical geometry.
Contents
- Server part
- Client side
- Initializing the map
- Determining the geolocation using HTML5
- Determining the geolocation using information from the server
- Calculating partially visible rectangular areas
- Calculating the size of caching areas
- Using delay when redrawing
- Calculating coordinates and hashes of partially visible areas
- Redrawing the displayed photos
- Distance on the map
- Conclusion
Server part
The following methods of selecting and storing geoinformation in the database were designed:
- SQL Server built-in geography data type.
- Normal selection with restrictions.
- Using additional tables.
Further, these methods will be described in details.
Built-in geotypes
As is known, SQL Server 2008 supports geography and geometry data types, which allow to specify geographical (on the sphere) and geometrical (on the plane) information, such as points, lines, polygons etc.. In order to retrieve all photos enclosed by a rectangle with coordinates (lngMin latMin) and (latMax lngMax), you can use the following query:
DECLARE @h geography;
DECLARE @p geography;
SET @rect =
geography::STGeomFromText('POLYGON((lngMin latMin, lngMax latMin, lngMax latMax, lngMin latMax, lngMin latMin))', 4326);
SELECT TOP @cound id, image75Path, geoTag.Lat as Lat, geoTag.Long as Lng, popularity, width, height
FROM Photo WITH (INDEX(IX_Photo_geoTag))
WHERE @rect.STContains(geoTag) = 1
ORDER BY popularity DESC
Note that the polygon is oriented counterclockwise and the spatial index IX_Photo_geoTag defined by the coordinates is used (besides, spatial indexes are built using B-trees).
However, it turned out that in Microsoft SQL Server 2008, spatial indexes do not work if the column with geotypes can accept NULL values, and a composite index cannot contain a column with geography data type, and this question was discussed on Stackoverflow. That's why the performance of such queries (without indexes) becomes very low.
The following approaches can solve this problem:
- Since
NULLvalues cannot be used, the default values for this column are coordinates (0, 0) which point to a location in the Atlantic Ocean near Africa (the starting point for measuring latitude and longitude). However, in this place as well as nearby the real points can be located, and the photos not from the map should be ignored. If you change zero point (0, 0) to far north point (0, 90), then everything will be much better, because latitude 90 points to the edge of the map, and you should ignore this value when building the grid (i.e. build up to latitude 89). - Using SQL Server 2012 or higher and changing the compatibility level of the database to 110 or higher by executing
ALTER DATABASE database_name SET COMPATIBILITY_LEVEL = 110. In this version of SQL Server, the bug withNULLvalues of geotypes was fixed and the support of polygons of different orientations (counterclockwise and clockwise) was added.
Despite the wide possibilities of geotypes (they allow you to make not only a simple selection as shown above, but also to use distances and different polygons), we did not use them in our project.
Normal selection
To select photos from the area bounded by coordinates (lngMin latMin) and (latMax lngMax), use the following query:
SELECT TOP @Count id, url, ...
FROM Photo
WHERE latitude > @latMin AND longitude > @lngMin AND latitude < @latMax AND longitude < @lngMax
ORDER BY popularity DESC
Note that in this case you can create any indexes for latitude and longitude fields (in contrast to the first method), because an ordinary float data type is used. However, there are 4 comparison operations in this selection.
Using additional hash table
The most optimal solution to the problem of selecting photos from certain areas is to create additional table Zooms which stores strings containing hashes of areas for each zoom, as shown below.
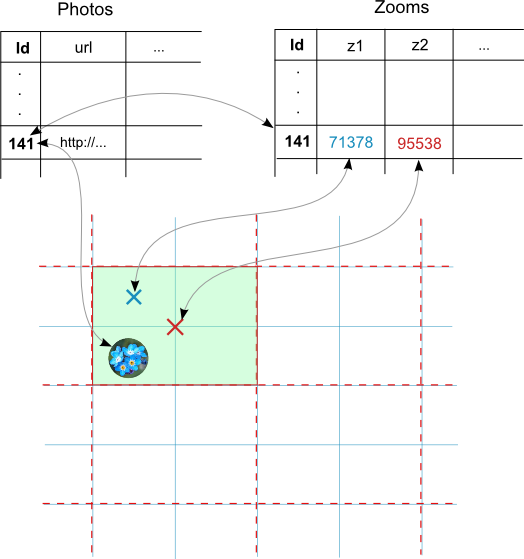
The following SQL query can be used (zn — current zoom level):
DECLARE @hash float;
SET @hash = (@latMin + 90) + (@lngMin + 180) * 180 + (@latMax + 90) * 64800 + (@lngMax + 180) * 11664000;
SELECT TOP @Count id, url, ...
FROM Photo WHERE id = (SELECT id FROM Zooms WHERE zn = @hash)
The disadvantage of this approach is that the additional table occupies additional memory space.
Despite the advantages of the latter method, we used the second method (Normal selection) on the server, as it showed good performance.
Caching photos for multi-threaded access
After extracting the information from the database in one way or another, photos are placed in the server cache using synchronizing object to support multithreading as follows:
private static object SyncObject = new object();
...
List<Photo> photos = (List<Photo>)CachedAreas[hash];
if (photos == null)
{
    // Use lock to avoid extracting from and adding to the cache more than once.
    lock (SyncObject)
    {
        photos = (List<Photo>)CachedAreas[hash];
        if (photos == null)
        {
            photos = PhotoList.GetAllFromRect(latMin, lngMin, latMax, lngMax, count);
            // Adding information about photos to the cache with a storage time of 2 minutes with a high storage priority.
            CachedAreas.Add(hash, photos, null, DateTime.Now.AddSeconds(120), Cache.NoSlidingExpiration, CacheItemPriority.High, null);
        }
    }
}
// Further usage of CachedAreas[hash]
This section described server functionality for retrieving photos from the database and saving them to the cache. The next section will describe what happens on the client side in the browser.
Client side
To visualize the map and photos on it, the Google Maps API was used. First, the user map must be moved to a certain place, corresponding to the geolocation of the photos.
Initializing the map
There are two ways to determine the geolocation when initializing the map: to use the capabilities of HTML5 or to use pre-calculated coordinates for regions.
Determining the geolocation using HTML5
function detectRegion() {
    if (navigator.geolocation) {
        navigator.geolocation.getCurrentPosition(success);
    } else {
        map.setZoom(defaultZoom);
        map.setCenter(defaultPoint);
    }
}

function success(position) {
    ...
    map.setZoom(defaultZoom);
    map.setCenter(new google.maps.LatLng(position.coords.latitude, position.coords.longitude));
}
The disadvantage of this approach is that not all browsers support this functionality of HTML5 and the user may not allow access to geoinformation on his device.
Determining the geolocation using information from the server
The map is initialized in the section of the source code below, where bounds is the coordinates of the region (populated area, region or country) returned by the server. The approximate zoom level is calculated in the function getZoomFromBounds (taken from stackoverflow).
var northEast = bounds.getNorthEast();
var southWest = bounds.getSouthWest();
var myOptions = {
    zoom: getZoomFromBounds(northEast, southWest),
    center: new google.maps.LatLng((northEast.lat() + southWest.lat()) / 2, (northEast.lng() + southWest.lng()) / 2),
    mapTypeId: google.maps.MapTypeId.ROADMAP,
    minZoom: 3,
    maxZoom: 19
}
map = new google.maps.Map(document.getElementById("map_canvas"), myOptions);
function getZoomFromBounds(ne, sw) {
    var GLOBE_WIDTH = 256; // a constant in Google's map projection
    var west = sw.lng();
    var east = ne.lng();
    var angle = east - west;
    if (angle < 0) {
      angle += 360;
    }
    return Math.round(Math.log($('#map_canvas').width() * 360 / angle / GLOBE_WIDTH) / Math.LN2);
}
On the server, the regions are calculated depending on the user's IP address. To aggregate all coordinates of boundaries for each region, google geocoding api was used, although it is not legitimate to use such information offline; in addition, there is a limit of 2500 requests per day. For each city, region and country from our database, a query was generated that returned the required boundaries of viewport and bounds. They differ only for large areas that cannot fit completely into the viewport. If the server returned an error, then other queries were used in which the native language of that region or English was used, the part {Populated area} was removed, etc. http://maps.googleapis.com/maps/api/geocode/xml?address={Country},{Region},{Populated area}&sensor=false
For example, for the following query: http://maps.googleapis.com/maps/api/geocode/xml?address=Россия, Ивановская%20область, Иваново&sensor=false
...
<location>
    <lat>56.9951313</lat>
    <lng>40.9796047</lng>
</location>
<location_type>APPROXIMATE</location_type>
<viewport>
    <southwest>
        <lat>56.9420231</lat>
        <lng>40.8765941</lng>
    </southwest>
    <northeast>
        <lat>57.0703221</lat>
        <lng>41.0876169</lng>
    </northeast>
</viewport>
<bounds>
<southwest>
    <lat>56.9420231</lat>
    <lng>40.8765941</lng>
</southwest>
<northeast>
    <lat>57.0703221</lat>
    <lng>41.0876169</lng>
</northeast>
</bounds>
...
Calculating partially visible rectangular areas
Calculating the size of caching areas
So, as mentioned earlier, all photos on both client and server side are cached by rectangular areas, the starting point of which is an arbitrary point (in our case the point with coordinates (0, 0)), and the size is calculated depending on the current zoom level as follows:
// The initial window at which initMapSizeLat and initMapSizeLng were calculated
var initDefaultDimX = 1000, var initDefaultDimY = 800;
// The current default viewport which depends on the size of the areas.
var currentDefaultDimX = 1080, var currentDefaultDimY = 500;
var initMapSizeLat = 0.0003019; var initMapSizeLng = 0.00067055;
// The coefficient of size reduction (increase).
var initRatio = 0.75;

// To calculate the size of the smallest caching area, the map was zoomed in to the maximum zoom level
// I.e. initMapSizeLat and initMapSizeLng were calculated empirically.
var initZoomSize = new google.maps.Size(
initMapSizeLat / initDefaultDimX * currentDefaultDimX * initRatio,
initMapSizeLng / initDefaultDimY * currentDefaultDimY * initRatio);

// All subsequent sizes of areas can be calculated based only on the smallest area (by multiplying each size by 2, because with increasing the zoom level by 1, the linear dimensions increase by 2 times, and the quadratic dimensions increase by 4 times).
function initZoomSizes() {
    zoomSizes = [];
    var coef = 1;
    for (var i = 21; i >= 0; i--) {
        zoomSizes[i] = new google.maps.Size(initZoomSize.width * coef, initZoomSize.height * coef);
        coef *= 2;
    }
}
Thus, at each zoom level, the size of the rectangular area is 0.75^2=0.5625 from the size of the current viewport, if it has width of 1080px and height of 500px.
Using delay when redrawing
Since the redrawing of all the photos on the map is not a fast operation (as will be shown later), we decided to do it with some delay after the user input:
google.maps.event.addListener(map, 'bounds_changed', function () {
    if (boundsChangedInverval != undefined)
        clearInterval(boundsChangedInverval);

    var zoom = map.getZoom();
    boundsChangedInverval = setTimeout(function () {
        boundsChanged();
    }, prevZoom === zoom ? moveUpdateDelay : zoomUpdateDelay);

    prevZoom = zoom;
});
Calculating coordinates and hashes of partially visible areas
Calculation of coordinates and hashes of all the rectangles that overlap the visible window with coordinates (latMin, lngMin) and dimensions calculated using the algorithm described earlier is done as follows:
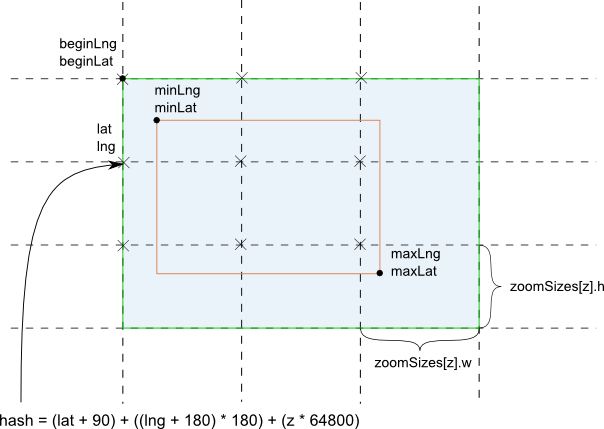
var s = zoomSizes[zoom];
var beginLat = Math.floor((latMin - initPoint.x) / s.width) * s.width + initPoint.x;
var beginLng = Math.floor((lngMin - initPoint.y) / s.height) * s.height + initPoint.y;
var lat = beginLat;
var lng = beginLng;

if (lngMax <= beginLng)
    beginLng = beginLng - 360;

while (lat <= maxlat) {
    lng = beginLng;
    while (lng <= maxLng) {
        // lat and normalizeLng(lng) coordinates are the coordinates of the overlapping rectangles.
        // Longitude normalization is used because the right boundary can be greater than 180 or the left boundary can be less than -180.
        loadIfNeeded(lat, normalizeLng(lng));
        lng += s.height;
    }
    lat += s.width;
}

function  normalizeLng(lng)
{
    var rtn = lng % 360;
        if (rtn <= 0)
            rtn += 360;
        if (rtn > 180)
            rtn -= 360;
        return rtn;
}
After that, for each area, the following function is called, which sends the request to the server, if necessary. The formula of hash calculation returns a unique value for each area, because the starting point and dimensions are fixed.
function loadIfNeeded(lat, lng) {
    var hash = calculateHash(lat, lng, zoom);
    if (!(hash in items)) {
        // Send a query to the database and put this cell in the client cache.
    } else {
        // Do nothing.
    }
}

function calculateHash(lat, lng, zoom) {
    // lat: [-90..90]
    // lng: [-180..180]
    return (lat + 90) + ((lng + 180) * 180) + (zoom * 64800);
}
Redrawing the displayed photos
After all the photos are downloaded or extracted from the cache, some of them need to be redrawn. With a large number of photos, or markers, in one place, some of them should be hidden, but then it becomes unclear how many photos are located in this place. To solve this problem, we decided to support two types of markers: markers displaying photos and markers showing that there are photos in this place. In addition, if all markers are hidden when the boundaries are changed, and then they are redisplayed, then the user may notice flickering. To solve these problems, the following algorithm was developed:
- Extracting all visible photos from the client cache to the array
visMarks. Calculation of these areas with photos was described above. - Sorting the received markers by popularity.
- Finding overlapping markers using
markerSize,SmallMarkerSize,minPhotoDistRatioandpixelDistance. - Creating arrays of large markers with
maxBigVisPhotosCountand small markers withmaxSmlVisPhotosCount. - Defining old markers that should be hidden and adding them to
smlMarksToHideandbigMarksToHideusingrefreshMarkerArrays. - Updating the visibility and zoom index
zIndexfor new markers that should be displayed usingupdateMarkersVis. - Adding photos, which became visible at the current time, to the feed using
addPhotoToRibbon.
function redraw() {
    isRedrawing = true;

    var visMarker;
    var visMarks = [];
    var visBigMarks2;
    var visSmlMarks2;
    var bigMarksToHide = [];
    var smlMarksToHide = [];

    var photo;
    var i, j;

    var bounds = map.getBounds();
    var northEast = bounds.getNorthEast();
    var southWest = bounds.getSouthWest();
    var latMin = southWest.lat();
    var lngMin = southWest.lng();
    var latMax = northEast.lat();
    var lngMax = northEast.lng();
    var ratio = (latMax - latMin) / $("#map_canvas").height();

    var zoom = map.getZoom();
    visMarks = [];
    var k = 0;

    var s = zoomSizes[zoom];
    var beginLat = Math.floor((latMin - initPoint.x) / s.width) * s.width + initPoint.x;
    var beginLng = Math.floor((lngMin - initPoint.y) / s.height) * s.height + initPoint.y;
    var lat = beginLat;
    var lng = beginLng;

    i = 0;
    if (lngMax <= beginLng)
        beginLng = beginLng - 360;

    // Extracting all visible markers.
    while (lat <= latMax) {
        lng = beginLng;
        while (lng <= lngMax) {
            var hash = calcHash(lat, normLng(lng), zoom);
            if (!(hash in curItems)) {
            }
            else {
                var item = curItems[hash];
                for (photo in item.photos) {
                    if (bounds.contains(item.photos[photo].latLng)) {
                        visMarks[i] = item.photos[photo];
                        visMarks[i].overlapCount = 0;
                        i++;
                    }
                }
            }
            k++;
            lng += s.height;
        }
        lat += s.width;
    }

    // Sorting markers by popularity.
    visMarks.sort(function (a, b) {
        if (b.priority !== a.priority) {
            return b.priority - a.priority;
        } else if (b.popularity !== a.popularity) {
            return b.popularity - a.popularity;
        } else {
            return b.id - a.id;
        }
    });

    // Finding overlapping markers and markers that exceed a certain specified number.
    var curInd;
    var contains;
    var contains2;
    var dist;
    visBigMarks2 = [];
    visSmlMarks2 = [];
    for (i = 0; i < visMarks.length; i++) {
        contains = false;
        contains2 = false;
        visMarker = visMarks[i];

        for (j = 0; j < visBigMarks2.length; j++) {
            dist = pixelDistance(visMarker.latLng, visBigMarks2[j].latLng, zoom);
            if (dist <= markerSize * minPhotoDistRatio) {
                contains = true;
                if (contains && contains2)
                    break;
            }
            if (dist <= (markerSize + smallMarkerSize) / 2) {
                contains2 = true;
                if (contains && contains2)
                    break;
            }
        }

        if (!contains) {
            if (visBigMarks2.length < maxBigVisPhotosCount) {
                smlMarksToHide[smlMarksToHide.length] = visMarker;
                visBigMarks2[visBigMarks2.length] = visMarker;
            }
        } else {
            bigMarksToHide[bigMarksToHide.length] = visMarker;
            if (!contains2 && visSmlMarks2.length < maxSmlVisPhotosCount) {
                visSmlMarks2[visSmlMarks2.length] = visMarker;
            } else {
                visBigMarks2[j].overlapCount++;
            }
        }
    }

    // Adding markers that should be hidden to smlMarksToHide and bigMarksToHide.
    refreshMarkerArrays(visibleSmallMarkers, visSmlMarks2, smlMarksToHide);
    refreshMarkerArrays(visibleBigMarkers, visBigMarks2, bigMarksToHide);

    // Hiding invisible markers and displaying visible markers when zIndex changes.
    var curZInd = maxBigVisPhotosCount + 1;
    curZInd = updateMarkersVis(visBigMarks2, bigMarksToHide, true, curZInd);
    curZInd = 0;
    curZInd = updateMarkersVis(visSmlMarks2, smlMarksToHide, false, curZInd);

    visibleBigMarkers = visBigMarks2;
    visibleSmallMarkers = visSmlMarks2;

    // Adding visible photos to the feed.
    trPhotosOnMap.innerHTML = '';
    for (var marker in visBigMarks2) {
        addPhotoToRibbon(visBigMarks2[marker]);
    }

    isRedrawing = false;
}

function refreshMarkerArrays(oldArr, newArr, toHide) {
    for (var j = 0; j < oldArr.length; j++) {
        contains = false;
        var visMarker = oldArr[j];
        for (i = 0; i < newArr.length; i++) {
            if (newArr[i].id === visMarker.id) {
                contains = true;
                break;
            }
        }
        if (!contains) {
            toHide[toHide.length] = visMarker;
        }
    }
}

function updateMarkersVis(showArr, hideArr, big, curZInd) {
    var marker;
    var bounds = map.getBounds();

    for (var i = 0; i < showArr.length; i++) {
        var photo = showArr[i];
        if (big) {
            marker = photo.bigMarker;
            $('#divOvlpCount' + photo.id).html(photo.overlapCount);
        } else {
            marker = photo.smlMarker;
        }
        marker.setZIndex(++curZInd);
        if (marker.getMap() === null) {
            marker.setMap(map);
        }
    }

    for (i = 0; i < hideArr.length; i++) {
        marker = big ? hideArr[i].bigMarker : hideArr[i].smlMarker;
        if (marker.getMap() !== null) {
            marker.setMap(null);
            marker.setZIndex(0);
            if (!bounds.contains(hideArr[i].latLng))
                hideArr[i].priority = 0;
        }
    }

    return curZInd;
}

function addPhotoToRibbon(marker) {
    var td = createColumn(marker);

    if (isLatLngValid(marker.latLng)) {
        trPhotosOnMap.appendChild(td);
    } else {
        trPhotosNotOnMap.appendChild(td);
        if (photoViewMode == 'user') {
            var img = $("#photo" + marker.id).children()[0];
            $('#photo' + marker.id).draggable({
                helper: 'clone',
                appendTo: $('#map_canvas'),
                stop: function (e) {
                    var mapBoundingRect = document.getElementById("map_canvas").getBoundingClientRect();
                    var point = new google.maps.Point(e.pageX - mapBoundingRect.left, e.pageY - mapBoundingRect.top);

                    var latLng = overlay.getProjection().fromContainerPixelToLatLng(point);
                    marker.latLng = latLng;
                    marker.priority = ++curPriority;
                    placeMarker(marker);
                },
                containment: 'parent',
                distance: 5
            });
        }
    }
}
Distance on the map
To calculate the distance between two points on the map in pixels the following function is used:
var Offset = 268435456;
var Radius = 85445659.4471;

function pixelDistance(latLng1, latLng2, zoom) {
    var x1 = lonToX(latLng1.lng());
    var y1 = latToY(latLng1.lat());
    var x2 = lonToX(latLng2.lng());
    var y2 = latToY(latLng2.lat());
    return Math.sqrt((x1 - x2) * (x1 - x2) + (y1 - y2) * (y1 - y2)) >> (21 - zoom);
}

function lonToX(lng) {
    return Math.round(Offset + Radius * lng * Math.PI / 180);
}

function latToY(lat) {
    return Math.round(Offset - Radius * Math.log((1 + Math.sin(lat * Math.PI / 180)) / (1 - Math.sin(lat * Math.PI / 180))) / 2);
}
This function was also found on stackoverflow.
To make the markers look like circles with photos (like vkontakte), the plugin RichMarker was used with the addition of an arbitrary style to div element.
Conclusion
It turned out that in order to display photos on the map quickly and correctly, we needed to solve quite interesting and non-trivial problems related to caching and spherical geometry. Despite the fact that not all described methods were actually used in our project, time was not wasted, as the experience we get might be useful in other projects, and it might also be useful for those who have read and understood this article.
